What is an Essential Business Dashboard?
An essential business dashboard is a visual display that puts a company's core numbers, such as leads, sales, delivery, customer satisfaction and revenue, on one screen. It shows each KPI against its target in charts and gauges, so anyone in the business can see how things stand without digging through a spreadsheet. The word essential is doing real work here. This is the short list of numbers every business needs, not a wall of metrics only an analyst could love.
Overview
Most businesses already have the data. Leads sit in an inbox or a CRM, orders in a sales ledger, revenue in the accounting system, and complaints wherever complaints happen to land. What's usually missing is one place where those numbers meet. A dashboard supplies that place. Put the figures side by side and the story connects itself: leads feed sales, sales feed revenue, and delivery and satisfaction decide whether anyone buys twice.
This example is deliberately small. Six KPIs cover the journey from first inquiry to repeat customer, which makes it a practical starting point for a business that has never tracked performance formally. It also suits teams moving off a tracking spreadsheet. If that's you, it's worth reading why KPI spreadsheets stop working as you grow before you rebuild the old one.
Who benefits from this dashboard?
- Business owners: the whole operation on one screen, from marketing effort through to money in the bank. No chasing, no version confusion.
- Managers new to KPIs: six numbers is a manageable habit. Track them for a quarter and you'll know which extra KPIs you actually need.
- Teams outgrowing spreadsheets: these KPIs map directly onto columns most tracking spreadsheets already contain, so the move is a transfer, not a redesign.
- Anyone reporting upward: when the bank, the board or a business partner asks how things are going, this screen is the answer.
Dashboard Example Overview
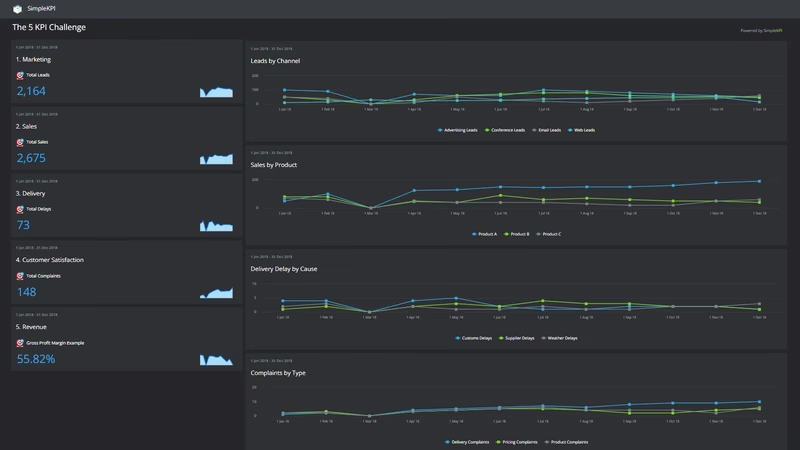
The dashboard pictured here is a general business board built in SimpleKPI. It tracks six KPIs, grouped around four questions:
- Is anyone interested? Leads by Channel counts new inquiries and splits them by source, so you can see which channels earn their keep. Tracking leads is also the first step toward any conversion metric you may want to improve later.
- Are they buying? Sales and Revenue carry the headline results. Read together, they show whether growth is coming from more orders or from bigger ones.
- Are we keeping our promises? Delivery measures how reliably products and services reach customers when expected. It's the most direct read on service quality you can get from your own records.
- Will they come back? Customer Satisfaction and Satisfied Customers track how the whole process feels from the other side, as a score and as a count of happy customers.
None of this needs a data warehouse. Every one of these six numbers can be counted from records the business already keeps.
Watch Leads by Channel next to Sales for a month before changing anything. The gap between the two tells you whether your problem is attention or conversion, and those need different fixes.
Creating an Essential Business Dashboard in SimpleKPI
-
Step 1 Pick the numbers that matter
Write down the path a customer takes through your business, from first inquiry to repeat order, and choose one measure for each stage. The six KPIs on this page are a ready-made answer, and the 5 essential KPIs challenge walks through the same thinking in more detail.
-
Step 2 Add your KPIs
Create each KPI in SimpleKPI with a target and an entry frequency. Weekly suits most of these; revenue can land monthly. Plans include unlimited KPIs, so nothing forces you to trim the list, but at this stage restraint is the feature.
-
Step 3 Connect your data
Bring numbers in by spreadsheet import, integrations or the API, or simply type them in each week. Manual entry gets dismissed too quickly. For six KPIs it takes minutes, and it builds the review habit that makes the dashboard worth having.
-
Step 4 Build the view
Gauges for targets, line charts for trends, one screen for everything. Resist the urge to add a second page. If the whole business doesn't fit on one view at this stage, the KPI list is too long.
-
Step 5 Share, review, adjust
Put the dashboard where people will see it and set scheduled KPI reports to carry the numbers to anyone who won't log in. As history builds, Kip, the built-in AI, can suggest targets and flag indicative benchmarks (AI estimates, not peer data). After a quarter, keep what gets acted on and replace what doesn't.
List of Essential Business KPIs
The table below covers every KPI on the example dashboard. The targets are general guidance; your own baseline beats any generic range.
| KPI Name | Typical Target | Description |
|---|---|---|
| Leads by Channel | Trending up | The number of new leads in the period, split by source. Shows which channels feed the pipeline and which just make noise. |
| Sales | Set against your plan | The number of sales closed by unit. Over time the trend reveals seasonal patterns worth planning stock and marketing around. |
| Delivery | 95% or higher on time | The share of orders delivered when promised. Focus on the misses and their causes; fixing those lifts satisfaction and repeat sales together. |
| Customer Satisfaction | 80% or higher | The percentage of surveyed customers rating their experience positively. A falling score is an early warning that arrives here before it reaches revenue. |
| Satisfied Customers | Growing with sales | The count of customers reporting a positive experience. Pairs with the satisfaction score so a strong percentage can't hide a shrinking base. |
| Revenue | On target or above | Total income for the period. The headline figure the other five KPIs exist to explain. |
Why Essential Business Dashboards Matter
Visible numbers change habits. When the week's leads, sales and delivery figures are on a screen rather than in a file nobody opens, performance becomes part of the normal conversation instead of a quarterly surprise. That shift costs almost nothing and starts on day one.
The deeper value is early warning. Revenue is a lagging number; by the time it dips, the cause is weeks old. Leads, delivery and satisfaction move first. A business watching all six figures together can respond while the problem is still cheap to fix.
For businesses that have never tracked performance, the small scale is the point. Six KPIs is enough to run a company honestly and few enough that tracking survives a busy month. Master these, and adding the next layer of KPIs becomes an expansion, not a rescue.
Build this dashboard yourself with SimpleKPI's KPI dashboards, and pay one flat price for unlimited users and KPIs.