What is a Startup Dashboard?
A startup dashboard is a visual display that brings a young company's vital signs, such as monthly recurring revenue, customer acquisition cost, churn and runway, together on one screen. It shows growth, spending and retention against plan, so founders and teams can act on the numbers instead of hunches. Startups need more than intuition to grow. They need data, and they need it where everyone can see it.
Overview
Startup numbers scatter early. Revenue sits in the billing system, spend in the bank account, signups in an analytics tool, and the runway math in a spreadsheet only one founder understands. A dashboard puts them side by side, and the relationships appear. Rising CAC against flat conversion is a marketing problem. Rising churn against a strong NPS is usually a product or pricing problem wearing a disguise.
Most startup dashboards lean one of three ways:
- Growth dashboards watch MRR, revenue growth rate and conversion, the numbers investors ask about first.
- Cash dashboards track burn rate and runway. Less exciting, more existential.
- Retention dashboards follow churn and NPS, because keeping a customer is cheaper than replacing one.
The example on this page combines all three, which suits a founder who wants the whole picture in one place. If your metrics currently live in a spreadsheet, this piece on outgrowing KPI spreadsheets will feel familiar.
Who benefits from this dashboard?
- Founders and CEOs: the financial and operational vitals in one view, which is most of what board prep actually needs.
- Investors and board members: transparency into performance and trajectory without chasing anyone for a deck.
- Product and marketing teams: conversion, acquisition cost and retention side by side, so strategy adjusts while the month is still live.
- Whoever owns the finances: burn and runway tracked continuously instead of recalculated in a hurry before each board meeting.
Dashboard Example Overview
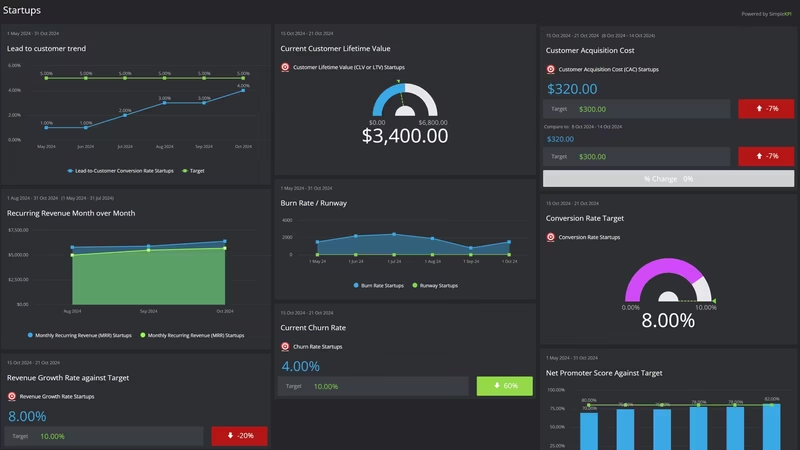
The dashboard pictured here tracks nine KPIs, grouped around four questions every startup gets asked:
- Are we growing? Monthly Recurring Revenue, Revenue Growth Rate and Conversion Rate give the headline trajectory, from visitor to paying customer to compounding revenue.
- What does growth cost? Customer Acquisition Cost and Gross Margin show whether that growth is bought at a sensible price.
- How long can we keep going? Burn Rate and Runway turn the bank balance into a deadline you can plan around.
- Do customers stay? Churn Rate and Net Promoter Score measure whether the product earns loyalty or just trials.
Nine numbers is deliberate. Each one changes a decision, and together they describe the health of the business the way an investor would want it described.
Watch CAC and Churn Rate on the same view. Cheap acquisition means little if customers leave before they repay what they cost to win.
Creating a Startup Dashboard in SimpleKPI
-
Step 1 Pick the metrics for your stage
Pre-revenue teams watch conversion and burn. Post-revenue teams add MRR, churn and CAC. Write down the handful of numbers that would change a decision this quarter, and skip the rest for now. The KPI pyramid approach is a useful way to connect big goals to the daily numbers underneath them.
-
Step 2 Add your startup KPIs
Create each KPI in SimpleKPI with a target and a frequency. Tags keep things organized by team or product line. Plans include unlimited KPIs, so the list can grow as the company does.
-
Step 3 Connect your data
Feed numbers in through spreadsheet imports, integrations or the API. Billing and finance data usually lands monthly, marketing and conversion data daily or weekly, and the dashboard updates as each arrives.
-
Step 4 Build views for different audiences
A board view with MRR, burn and runway. A growth view for marketing with CAC and conversion. Same data, different framing, and nobody sits through numbers that aren't theirs.
-
Step 5 Share, review, adjust
Put the dashboard on a screen, open it in the weekly review, and let scheduled KPI reports carry the numbers to investors who won't log in. Kip, the built-in AI, can suggest targets and flag indicative benchmarks (AI estimates, not peer data) as your history builds. Retire any KPI that never changes a decision.
List of Startup KPIs
The table below covers every KPI on the example dashboard. Targets are general guidance; your stage and business model matter more than any generic range.
| KPI Name | Typical Target | Description |
|---|---|---|
| Customer Acquisition Cost (CAC) | Trending down as channels mature | Total sales and marketing spend divided by new customers won. Read it next to gross margin to see how long each customer takes to pay back. |
| Churn Rate | Low single digits monthly | The percentage of customers who cancel in a period. The quiet killer of early-stage growth; small monthly numbers compound into large annual ones. |
| Burn Rate | Set from your runway target | Net cash leaving the business each month. The number that turns strategy debates into arithmetic. |
| Monthly Recurring Revenue (MRR) | Growing month over month | Predictable subscription revenue. The steadier this line, the easier every other conversation gets, fundraising included. |
| Revenue Growth Rate | Consistent month over month | How fast revenue grows period over period. Consistency beats a single spectacular month. |
| Net Promoter Score (NPS) | Above 30 and rising | How likely customers are to recommend you. An early warning for churn and a leading indicator of word-of-mouth growth. |
| Runway | 12-18 months | Months of cash left at the current burn rate. Raise or cut costs well before this gets short; both take longer than expected. |
| Gross Margin | Set from your business model | Revenue minus the direct cost of delivering it, as a percentage. Software models typically run high; hardware and services run lower. |
| Conversion Rate | 2-5% | The share of visitors or leads who become paying customers. Small improvements here lower CAC without spending another dollar. |
Why Startup Dashboards Matter
Visible numbers change behavior. When MRR, burn and churn sit on a screen the whole team can see, the company stops arguing about what's true and starts arguing about what to do, which is a much better argument to have.
There's a fundraising benefit too. These are the numbers investors ask about in diligence, and a team that answers from a live dashboard makes a different impression than one that promises to get back to them. The dashboard becomes the first draft of the data room.
Mostly, though, it's about timing. Runway is a deadline; churn, CAC and conversion are the levers that move it. By the time the bank balance makes a problem obvious, the cheap options are gone. A dashboard shows the levers while there's still time to pull them, and for a startup, timing is usually the whole game.
Build this dashboard yourself with SimpleKPI's KPI dashboards, and pay one flat price for unlimited users and KPIs.