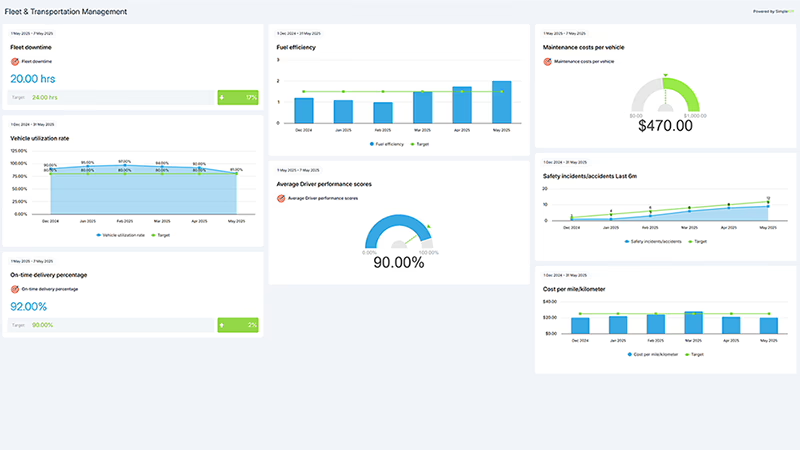
Fleet Performance Dashboard
March 2026, and the fuel card statement lands on the operations manager's desk. Diesel is up more than a dollar a gallon in a month. A regional fleet that never paid much attention to its miles per gallon is suddenly paying attention to nothing else.
The jump was real. The US average on-highway diesel price averaged $3.722 a gallon in February 2026 and $4.921 in March, according to the Energy Information Administration, and reached $6.291 in September. In the week of September 21 it hit $6.529, the highest weekly figure in the series, well past the $5.810 of June 2022.
And costs were already at a record before that. The American Transportation Research Institute's 2026 operational costs update put the average cost of running a truck at $2.336 a mile in 2025, the highest in the report's history, and $1.854 with fuel taken out. Carriers cut their truck counts by 2.4% and left another 10% of trucks without a driver.
So the obvious move is to slow the trucks down and stop the idling. Federal rules won't make that choice for you: FMCSA and NHTSA withdrew the proposed speed limiter rule for trucks over 26,000 pounds in July 2025. The fleet in this story is invented, a regional carrier that does exactly that, and its monthly figures are modeled. Three targets below have a published figure behind them, and the table says which.
What is a Fleet Management KPI Dashboard?
Overview
A fleet management KPI dashboard shows whether your loads arrive inside the window at a cost per mile you can live with, and whether the trucks and drivers carrying them will still be there next quarter.
It starts before the truck leaves the yard. Preventive maintenance compliance shows whether trucks get serviced when they're due, not when they break. Tractor utilization shows how many of the trucks you're paying for went out with a driver in the seat.
Then the road. Fuel economy is miles per gallon, measured on what you bought at the pump. Breakdowns per 100k miles counts the road calls and tows that stop a load. Crash rate per million miles is the safety number FMCSA itself uses.
Then the dock. On-time delivery asks the question the customer asks: did it arrive inside the appointment window?
Operating cost per mile adds all of it up. Driver turnover sits underneath everything, because a truck without a driver earns nothing, and every new driver starts on the wrong side of the learning curve.
Who benefits from this dashboard?
- Owner or General Manager: Cost per mile, split into fuel and non-fuel, against the same month last year. It's the number the shippers' rate negotiations come back to.
- Dispatch and Planning: On-time delivery by customer and lane tells them which transit times are fiction and which appointment windows need a phone call.
- Maintenance Manager: When PM compliance slips, breakdowns follow a month or two later. Watching both lets the shop see the road calls coming.
- Safety Director: Crash rate per million miles is a rolling 12-month figure, the same way an auditor will read it, so a bad month never hides inside a good quarter.
- Driver Manager and Recruiting: Turnover and utilization together show whether trucks are sitting because nobody is hiring, or because nobody is staying.
Work out fleet MPG as total miles divided by total gallons bought, never as the average of each truck's MPG. Averaging lets a spare truck that ran 2,000 miles count as much as a line-haul truck that ran 12,000. And if you pull reefers, take the trailer unit's fuel out first, or every hot week looks like a driver problem.
Dashboard Example Overview
The example carrier runs 140 tractors and about 150 drivers out of two terminals, in Columbus, Ohio, and Louisville, Kentucky. It hauls dry-van grocery and retail freight to distribution centers and stores within about 300 miles, most of it on fixed appointments, and drivers are home most nights. Eight KPIs, reported monthly:
- Fleet On-Time Delivery: Stops delivered inside the customer's appointment window, divided by stops delivered. Early arrivals that a grocery DC refuses count as late. The shipper scores the same stop from its side, as on the supply chain dashboard example.
- Operating Cost per Mile: Fuel, driver pay and benefits, truck and trailer payments, repair and maintenance, insurance, tires and tolls, divided by total miles. The same cost lines ATRI uses, so the comparison is fair.
- Fuel Economy: Total miles divided by total gallons bought. Idle fuel counts, because you paid for it.
- Tractor Utilization: Tractor-days dispatched divided by tractor-days available. When drivers leave, it falls before anything else does.
- Preventive Maintenance Compliance: PM services completed within their due window, divided by PM services due. 49 CFR 396.3 requires carriers to systematically inspect, repair and maintain their vehicles, and this is how you show it.
- Breakdowns per 100k Miles: Unplanned road calls and tows that stop a load, per 100,000 miles. Defects the shop finds during a PM don't count.
- Crash Rate per Million Miles: Recordable crashes in the last 12 months, per million miles over the same 12 months, using the 49 CFR 390.5 definition: a fatality, an injury treated away from the scene, or a tow-away.
- Driver Turnover Rate: Driver separations over the last three months, multiplied by four and divided by average drivers employed. A rolling quarter, because one driver leaving moves a single month by eight points.
In October 2024 the carrier is steady and a little sleepy about fuel. On-time delivery is 96.2%, cost per mile $2.30, fuel economy 6.75 MPG and driver turnover 45.0%. Trucks are governed at 68 mph, and idling is left to the driver.
The first problem of the period is in the shop, not on the fuel card. Winter backs up the PM schedule, compliance falls to 85.7% in February 2025, and breakdowns climb to 0.97 per 100k miles. A Saturday PM shift fixes it: by September 2025 compliance is 96.1% and breakdowns are down to 0.53. Through all of 2025, fuel economy averages 6.63 MPG and nobody asks why.
Then March 2026. Fuel goes from 54 cents a mile in February to 70 cents, and cost per mile jumps from $2.51 to $2.61 in a month. On April 1 the carrier drops the governed speed from 68 to 62 mph and sets engines to shut down after three minutes of idling, with no override.
The fuel side works at once. Fuel economy reaches 7.31 MPG in April and 7.35 in May, the best the fleet has recorded. Rolling crash rate keeps easing, to 0.58 per million miles in April. If the dashboard showed only fuel, the story would end here.
It doesn't. A truck that covers fewer miles in an 11-hour driving day misses more windows, and on-time delivery falls from 94.3% in April to 91.6% in June. Drivers paid by the mile lose miles, and drivers sitting at a hot dock in June can't run the air. Turnover climbs to 55.5% in May, 67.4% in June and 74.5% in July. By July, 84.2% of tractors are dispatched, against 90.9% in March, because there's nobody to put in the seat.
Cost per mile gives the game away. From May to June the fuel line falls by more than 7 cents a mile as diesel eases, yet cost per mile only moves from $2.70 to $2.68. Recruiting, training and fixed costs spread over fewer miles eat almost all of it.
So in mid-July the carrier settles on a balance. Governed speed goes to 65 mph. Trucks may idle when the cab is above 85°F or below 40°F. Planners rebuild transit times on the 20 longest lanes at the new speed, two grocery customers agree to move their appointment windows, and drivers are paid hourly for dock waits beyond two hours.
By September 2026, fuel economy is 7.17 MPG, giving back part of the gain but still well clear of 6.80 the September before. That's about 8,000 fewer gallons in the month, close to $49,000 at the fleet's September price. On-time delivery is back to 94.7%, and turnover is down to 55.3%.
Two results still sting. On-time delivery hasn't reached its 96% target, and may not at 65 mph without more windows moved. And cost per mile is $2.82, the highest on the board, because September's diesel average was the highest in the EIA series, which goes back to 1994. The board can't fix the diesel price. What it can show is that the non-fuel part of the cost has stopped climbing.
Creating a Fleet Management Dashboard in SimpleKPI
-
Step 1 Write one crash and breakdown rule for both terminals
Use the federal definition of a recordable crash, not your insurer's or your drivers'. Decide whether a road call that a driver fixes in 20 minutes is a breakdown, and whether a tire that blows in the yard counts. Write it down, because two terminals counting differently will produce two different safety records from the same fleet.
Still deciding which measures belong on the board? The guide to choosing KPIs goes deeper.
-
Step 2 Take every mile from the same source
ELD or odometer miles, fuel-tax miles and the paid miles in your rating software are three different numbers. Cost per mile, MPG, breakdowns and crash rate all divide by miles, so pick one source for all four. Mix them and a change in routing software can move your safety record.
-
Step 3 Give dispatch, the shop and safety their own view
Dispatch needs on-time delivery by customer every morning. The shop needs PM compliance and breakdowns weekly, next to the list of trucks coming due. The owner needs a monthly view of cost per mile split into fuel and non-fuel, with turnover and utilization beside it, against the same month last year.
-
Step 4 Price every fuel policy in windows and drivers
Before you change governed speed, idle rules or route plans, write down what you expect to happen to on-time delivery, turnover and utilization, not just MPG. Check all four after 60 days. The fuel saving shows up in the first month. The cost of it usually takes two.
List of Fleet Management KPIs
Cost per mile and driver turnover have an ATRI average to compare against, and fuel economy has NACFE's study fleets. The rest are marked starting point: replace them with your own numbers after a year.
| KPI Name | Typical Target | Description / Calculation |
|---|---|---|
| Fleet On-Time Delivery | ≥ 96% (starting point) | Stops delivered inside the appointment window divided by stops delivered. |
| Operating Cost per Mile | ≤ $2.40 (ATRI 2025 average $2.336) | All tractor operating costs, fuel included, divided by total miles. Lower is better. Read fuel and non-fuel separately. |
| Fuel Economy | ≥ 7.0 MPG (NACFE study fleets 7.77) | Total miles divided by total gallons bought, idle fuel included. |
| Tractor Utilization | ≥ 90% (starting point) | Tractor-days dispatched divided by tractor-days available. |
| Preventive Maintenance Compliance | ≥ 95% (starting point) | PM services completed within their due window divided by PM services due. |
| Breakdowns per 100k Miles | ≤ 0.6 (starting point) | Unplanned road calls and tows that stop a load, divided by miles, times 100,000. Lower is better. |
| Crash Rate per Million Miles | ≤ 0.75 (starting point; FMCSA unsatisfactory above 1.5) | Recordable crashes in 12 months divided by miles in the same 12 months, times 1,000,000. Lower is better. |
| Driver Turnover Rate | ≤ 40% (ATRI 2025 average 44.2%) | Separations over the last three months, times four, divided by average drivers employed. Lower is better. |
The NACFE figure comes from its 2024 Fleet Fuel Study, where 14 fleets running 75,000 trucks averaged 7.77 MPG in 2023. Those fleets are chosen for their fuel programs, so treat 7.77 as a ceiling to work toward. The 0.75 crash rate target is half of FMCSA's 1.5 line in 49 CFR Part 385, Appendix B, which the agency set at roughly double the 0.747 national average it measured in fiscal years 1994 to 1996.
More Fleet KPIs to Choose From
These eight fit a regional dry-van carrier. A last-mile van fleet will care more about stops per route, a tanker fleet about product contamination, and a municipal fleet about cost per vehicle rather than cost per mile. The free KPI generator drafts a fleet and transport KPI set for your operation, with names, descriptions and formulas you can export to Excel or open in SimpleKPI.
Prefer a spreadsheet? Download 8 fleet and transport KPIs in Excel, each with a description, unit and direction. It's a broader starter set than this board, with maintenance cost per vehicle, fleet downtime and a driver performance score alongside fuel efficiency, utilization, on-time delivery, cost per mile and safety incidents.
Why Fleet Dashboards Matter
In a trucking operation each number has its own owner and its own system. Fuel lives on the fuel card, delivery times in the TMS, PMs in the shop software, crashes in the safety file and turnover in payroll. Each manager can report a decent month while the fleet as a whole goes backward.
Most of the eight pull against at least one other. Governed speed trades fuel economy against on-time delivery, because the 11-hour driving limit doesn't stretch. Idle rules trade fuel against drivers who sleep in the cab or wait at hot docks. PM compliance takes trucks off the road for a day, so utilization dips to buy fewer breakdowns later. Pushing utilization with longer days lifts miles until turnover catches up with it.
None of that means a fuel program is a mistake. The example carrier kept most of its MPG gain. It just stopped paying for it with late deliveries and empty seats once the dashboard put all three next to each other.
With diesel at a record in September, the most useful change you can make this month is to split cost per mile in two on the board. Put fuel per mile next to non-fuel cost per mile, and compare the non-fuel line with ATRI's $1.854. That's the part the operation controls, and it's the one a diesel spike hides.
Building it in SimpleKPI
Build this dashboard yourself with SimpleKPI's KPI dashboards, or start from the Manufacturing KPIs template. The mechanics are the same whatever you track:
- KPIs: each one gets a target, an entry frequency and tags, so you can report by team, site, product or whatever you split the numbers by.
- Data: type numbers in, import a spreadsheet, or use an integration or the API. The dashboard updates as each number lands, so daily and monthly KPIs sit side by side.
- Reports: scheduled KPI reports email the numbers to people who never log in.
- AI: Kip, the built-in AI, suggests targets and flags indicative benchmarks (AI estimates, not peer data) once some history builds up.
- Price: $79 a month for unlimited users and KPIs, as one flat price, with a 14-day free trial and no card needed.