What is a Construction Project Dashboard?
A construction project dashboard is a visual display that brings a project's key KPIs, such as completion percentage, budget variance, labor productivity and safety incidents, together on one screen. It shows how the build is tracking against plan in charts, gauges and trend lines, so anyone can see where the job stands without chasing site reports. Project managers use it to run the build week to week. Owners and directors use it to check that cost, schedule and safety are holding across every active site.
Overview
Construction data scatters by default. Progress sits with the site team, costs with finance or the commercial team, safety records with the HSE file, and the schedule in planning software. By the time someone reconciles it all into a monthly report, the project has moved on. A dashboard puts those numbers side by side and keeps them current, and that's where the value is: budget variance means more when it sits next to completion percentage and change order frequency, because together they tell you whether an overrun is waste or scope.
Most construction dashboards concentrate on three things:
- Delivery covers completion percentage and schedule adherence, the numbers a client asks about first.
- Cost is budget variance, material cost per square meter and change orders. Overruns rarely announce themselves; they creep, and a weekly view catches the creep.
- Site performance takes in labor productivity, equipment utilization and safety incidents, the daily measures that decide whether the other two hold.
The example on this page covers all three, which suits a project manager who wants one view of the whole job. If you're building your first board, this comprehensive guide to KPI dashboards covers the ground rules.
Who benefits from this dashboard?
- Project managers: watch progress, cost and productivity in one place, and catch slippage while there's still schedule left to recover it.
- Construction firms: track multiple projects, compare margin performance and spot the job that's quietly going wrong before final account.
- Finance teams: a real-time view of costs, commitments and budget variances, without waiting for month end.
- Executives and owners: safety, cost and progress summaries across all active projects. Usually all a board pack needs.
Dashboard Example Overview
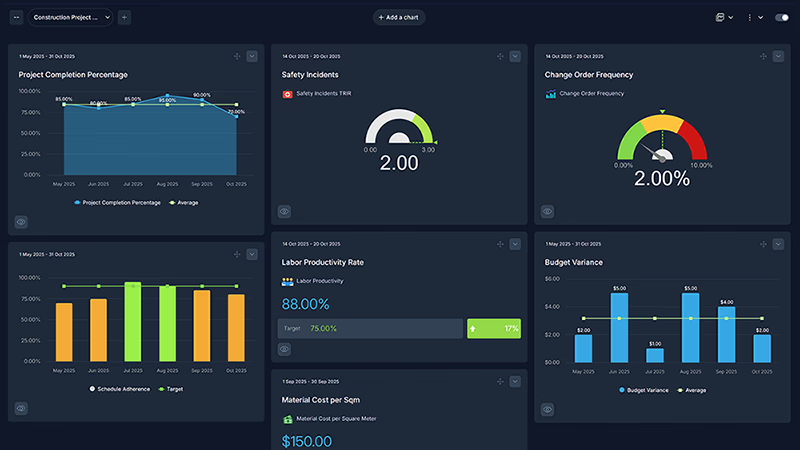
The dashboard pictured here is a construction project board built in SimpleKPI. It tracks eight KPIs, grouped around four questions:
- Are we on schedule? Project Completion Percentage and Schedule Adherence compare work done against the plan, so slippage shows up in weeks, not at handover.
- Are we on budget? Budget Variance and Material Cost per Square Meter track actual spend against estimate, the two numbers that decide the margin.
- How is the site performing? Labor Productivity, Equipment Utilization and Safety Incidents cover the crews and plant doing the work. Safety sits on the same screen as output deliberately; neither should be read alone.
- Is the scope holding? Change Order Frequency counts revisions. A rising count explains a lot of budget variance before anyone has to go digging.
None of this needs special instrumentation. Every KPI here can be counted from records a site office already keeps: the schedule, timesheets, invoices, the incident log and the change register.
Use conditional formatting to flag KPIs that drift into the red on schedule or budget. A gauge turning red on a Tuesday costs far less than a surprise in the monthly cost report.
Creating a Construction Project Dashboard in SimpleKPI
-
Step 1 Map the project's stages
Write down the phases the build passes through, from groundwork to handover, and pick the measure that matters at each one. Keep the list short; eight KPIs run this whole example. Browse these 200 KPI examples if you want a wider menu to choose from.
-
Step 2 Add your construction KPIs
Create each KPI in SimpleKPI with a target and an entry frequency. Tags keep things organized by project, site or subcontractor. Plans include unlimited KPIs, so a second or tenth project costs nothing extra to track.
-
Step 3 Connect your data
Feed numbers in through spreadsheet imports, integrations or the API. Timesheets and safety entries tend to arrive daily, cost data weekly or monthly from accounts, and the dashboard updates as each lands.
-
Step 4 Build views for different audiences
A site board for the weekly progress meeting, a cost view for the commercial team, a portfolio summary for directors. Same data, different framing.
-
Step 5 Share, review, adjust
Put the dashboard on a screen in the site office, bring it to progress meetings, and let scheduled KPI reports carry the numbers to clients and stakeholders who won't log in. Kip, the built-in AI, can suggest targets and flag indicative benchmarks (AI estimates, not peer data) as project history builds. Retire any KPI nobody acts on.
List of Construction Project KPIs
The table below covers every KPI on the example dashboard. Targets are general guidance; your contract terms and build type set the real numbers.
| KPI Name | Typical Target | Description |
|---|---|---|
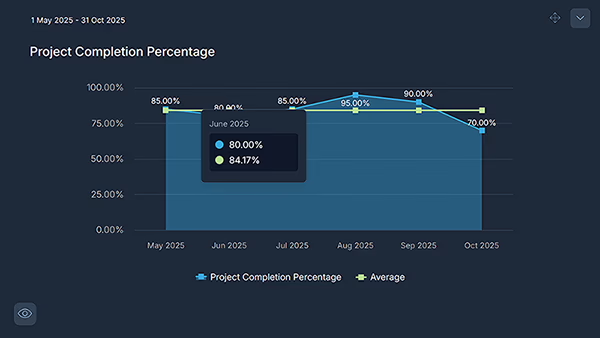
| Project Completion Percentage | On plan for the current phase | The percentage of planned work completed to date, measured against the schedule baseline rather than gut feel. |
| Budget Variance | Within 5-10% of budget | The gap between budgeted and actual cost to date. Read it weekly; overruns creep rather than jump. |
| Labor Productivity | Trending up | Output per labor hour, such as units installed or square meters completed. The first number to check when the schedule slips. |
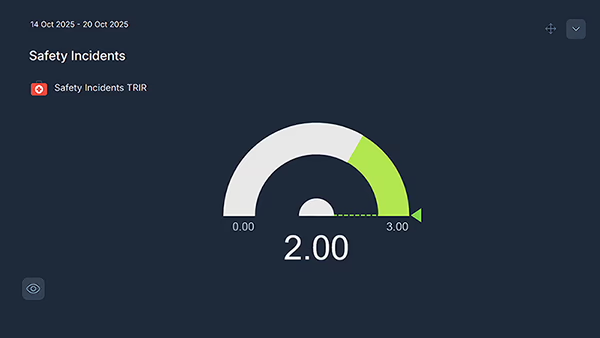
| Safety Incidents | Zero | The total number of reportable safety incidents this period. The one chart on the board nobody wants trending up. |
| Equipment Utilization | 70-85% | Hours plant and machinery spend in productive use versus hours available. Idle equipment is hired money doing nothing. |
| Material Cost per Square Meter | Set from your baseline | The cost of construction materials for a square meter built. It varies by build type, which is why the trend matters more than the number. |
| Change Order Frequency | Trending down | The number of change orders raised per phase. Each one carries cost and schedule impact well beyond the paperwork. |
| Schedule Adherence | 90% or above | The share of tasks finished on or before their planned date. The earliest warning that the completion date is at risk. |
Why Construction Project Dashboards Matter
Margins in construction are thin and problems compound. A delayed pour pushes the frame, the frame pushes the fit-out, and the penalty clauses do the rest. By the time a monthly cost report shows the damage, the cheap fixes are gone. A dashboard shortens that loop from a month to a day.
The deeper value is in the pairings. Budget variance next to change order frequency tells you whether an overrun is scope or waste. Labor productivity next to schedule adherence tells you whether to add crew or fix the sequencing. And safety incidents next to everything else keeps the one non-negotiable number in view exactly when delivery pressure builds. Residential builds and large-scale infrastructure ask the same questions; only the targets change.
There's a quieter benefit too. When progress, cost and safety are visible all week, the monthly review stops being an argument about whose spreadsheet is right and becomes a conversation about what to do next. That alone repays the setup time.
Build this dashboard yourself with SimpleKPI's KPI dashboards, start from the construction KPI template, and pay one flat price for unlimited users and KPIs.