What is a Rental and Lettings Dashboard?
A rental and lettings dashboard is a visual display that brings a property portfolio's key KPIs, such as actively let properties, viewings, letting times and arrears, together on one screen. It shows occupancy, demand and risk in charts and gauges, so anyone can see how the portfolio is performing without pulling a report. Lettings managers use it to run the week. Owners use it to check the portfolio is earning what it should.
Overview
Property management tends to be reactive. Problems get fixed after the fact, property by property, while the data that would have flagged them earlier sits in separate systems: applicants in the front-office software, viewings in diaries, arrears in the accounts, defects in a job log. A dashboard puts the whole letting cycle in one view, from applicant registration through viewings to a signed tenancy and, eventually, renewal or termination. How quickly problems surface has a direct effect on both the management workload and the consistency of rental income.
Most lettings dashboards watch three things:
- Occupancy and demand: how much of the portfolio is let and earning, and how many applicants are registered and actively looking.
- Letting speed: how long a property takes to let or re-let, and how many viewings it needs to get there. Voids are where rent quietly disappears.
- Risk: early terminations, arrears evictions, possession orders, reported defects. Small numbers on their own, expensive in combination.
The example on this page covers all three, which suits anyone responsible for keeping a managed portfolio earning.
Who benefits from this dashboard?
- Lettings managers: watch viewings, letting time and re-letting time, and spot the properties sticking on the market while there's still time to adjust price or presentation.
- Property managers: reported defects and properties per manager show whether the caseload is under control or quietly piling up.
- Portfolio owners and landlords: actively let properties, average tenure and arrears in one view. That answers the question that matters: is the portfolio earning?
- Agency principals: registered applicants against available stock is a live read on market appetite, and the number staffing and marketing decisions should hang on.
Dashboard Example Overview
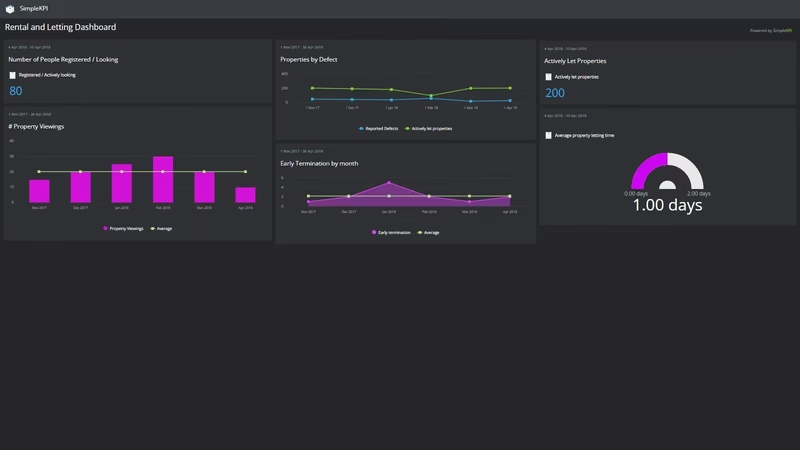
The dashboard pictured here tracks eleven KPIs across a managed residential portfolio, grouped around four questions:
- How much of the portfolio is earning? Actively Let Properties gives the headline occupancy count, and Average tenure of property shows whether tenants stay long enough to make each let worthwhile.
- How fast do we fill vacancies? Average property letting time, Re-letting time and Property Viewings measure the void period and the effort it takes to end one.
- Is the demand there? Registered / Actively looking counts the applicants your next tenancies will come from, which makes it a useful gauge of market appetite for the properties in your portfolio.
- Where is the risk? Early termination, Rent Arrears Evictions, Seeking Possession Served and Reported Defects flag problem tenancies and problem properties, while Property manager properties shows whether the workload behind it all is spread sensibly.
Nothing on this board needs a new system to feed it. Every KPI can be counted from records a lettings operation already keeps.
Put Re-letting time and Reported Defects side by side. A property that takes noticeably longer to re-let than the rest of the portfolio usually has a defect history that explains why.
Creating a Rental and Lettings Dashboard in SimpleKPI
-
Step 1 Map your letting cycle
Write down the stages a tenancy passes through, from applicant registration to renewal or termination, and pick the measure that matters at each one. If you want prompts, this list of 200 KPI examples has a rental and lettings section worth a skim.
-
Step 2 Add your lettings KPIs
Create each KPI in SimpleKPI with its target and frequency. Tags keep things organized by branch, property manager or landlord. Plans include unlimited KPIs, so tracking all eleven costs no more than tracking three.
-
Step 3 Connect your data
Feed numbers in through spreadsheet imports, integrations or the API. Viewings and registrations tend to arrive weekly, arrears and tenure monthly, and the dashboard updates as each lands.
-
Step 4 Build views for different audiences
A branch board for the office, a void-period view for negotiators, a portfolio summary for landlords. Same data, different framing. The seven golden rules for creating KPI dashboards will keep each view readable.
-
Step 5 Share, review, adjust
Put the board on the office screen, bring it to the Monday meeting, and let scheduled KPI reports carry the numbers to landlords who will never log in. Kip, the built-in AI, can suggest targets and flag indicative benchmarks (AI estimates, not peer data) as your history builds. Retire any KPI nobody acts on.
List of Rental and Lettings KPIs
The table below covers every KPI on the example dashboard. Targets are general guidance; letting markets vary enough that your own baseline beats any generic range.
| KPI Name | Typical Target | Description |
|---|---|---|
| Actively Let Properties | Set against portfolio size | The number of properties currently let and earning rent. The headline occupancy figure the rest of the board exists to explain. |
| Average property letting time | Under 4 weeks | The average time taken to let a new property. Every extra week is rent nobody gets back. |
| Average tenure of property | 12 months or more | The average tenancy length per property over a 12 month period. Long tenure means fewer voids and lower re-letting costs. |
| Early termination | Low and falling | The number of tenancies ended before the contract date. A cluster on one property or one manager deserves a closer look. |
| Property manager properties | Set from your baseline | The average number of properties managed per property manager. A workload measure; watch defects and arrears when it climbs. |
| Property Viewings | Falling per completed let | The number of viewings a property takes before a successful tenancy agreement. A high count points at price or presentation. |
| Registered / Actively looking | Trending up | The number of registered people actively looking for a property. This is the demand pipeline your next lets come from. |
| Re-letting time | Under 2 weeks | The average number of weeks taken to re-let a property between tenancies. The void period, measured honestly. |
| Rent Arrears Evictions | As close to zero as possible | The percentage of tenants evicted as a result of rent arrears. Late-stage evidence of early-stage screening problems. |
| Reported Defects | Stable or falling | The number of defects reported per month. A leading indicator for maintenance spend, tenancy length and re-letting time. |
| Seeking Possession Served | Rare; investigate any rise | The number of possession orders served. Small numbers, big signal. |
Why Rental and Lettings Dashboards Matter
Rent is a lagging number. By the time income dips, the causes are months old: a slow re-let in spring, an arrears case that started small, a tenant who gave notice because a defect never got fixed. A dashboard that shows demand, letting speed and defects alongside occupancy lets a manager act on the leading numbers while they're still cheap to fix.
It also surfaces trends no individual property manager can see from inside their own caseload. One early termination is a story. A rising count across the portfolio is a screening problem. A single flat that won't shift is bad luck, but a climbing average letting time is a pricing problem. This is where a dashboard earns its keep: spotting rental trends and gauging market appetite for the properties within your portfolio before the accounts do.
And it keeps workload honest. Properties per manager sitting beside defects and arrears tells you whether a performance problem is a people problem or a capacity problem. One screen, eleven numbers, and the state of the whole portfolio in a glance.
Build this dashboard yourself with SimpleKPI's KPI dashboards, start from the rental and lettings KPI template, and pay one flat price for unlimited users and KPIs.