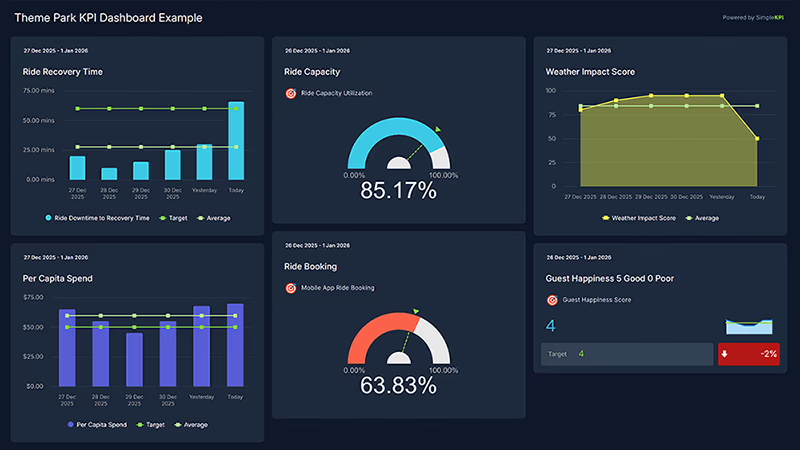
Theme Park Guest Experience Dashboard
2:40 on a Saturday in July. A storm cell is eight miles out, the lightning system has put every outdoor coaster on hold, and 1,200 people are standing in the flagship coaster's queue in 95-degree heat, waiting to hear whether it reopens. Forty minutes later the sky is clear. The coaster is still cycling empty trains for its checks, and guest relations has a line of its own.
Regional parks lived that afternoon over and over in 2025. Six Flags, North America's largest regional park operator, reported that 379 of its 2,042 planned operating days in the second quarter of 2025 were weather impacted, including 49 days when parks closed entirely. Attendance for the quarter fell 9%, and its active pass base ended June down about 8%.
Most of what's published about park attendance covers the giants. The TEA Global Experience Index, formerly the Theme Index, ranks the 20 biggest parks in North America, and the smallest on its 2024 list, Hersheypark, drew 3.0 million visits. A regional park lives on far less: pass holders who come back again and again, a few dozen peak days, and a weather forecast that can decide the month.
This example follows an invented regional park in the inland Southeast, with 38 rides and about 1.3 million visits a year. It isn't a real park, and every monthly figure is modeled. Its summer of 2025 is our version of the season described above.
What is a Theme Park Guest Experience KPI Dashboard?
Overview
A theme park guest experience dashboard shows whether the people who came through the gates got the rides, the lines and the day they paid for, and whether they'll be back next year.
It starts at the gate. Attendance counts the visits and sets the scale for everything else on the board.
Then the rides. Ride availability measures how much of the scheduled operating time the rides actually ran. Top ride wait time measures what guests paid for that in the queue. The two move together: lose a coaster for an afternoon and every line near it grows.
Then the spend. Per capita spending covers tickets, parking and everything bought inside the gates. Food and beverage per capita gets its own line, since it's the in-park number that heat, crowds and queue length push around most.
Then how the day felt. Guest Net Promoter Score comes from the post-visit survey, and complaints per 10,000 visitors from guest relations. Season pass renewal rate is the slowest number here and the most telling, because it's a pass holder's verdict on a whole year. Ride injuries per million attendees sits over all of it.
Who benefits from this dashboard?
- General Manager: Gets one view of whether a weak month came from the weather, the rides or the guests, before the owners or the regional VP ask.
- Director of Park Operations: Ride availability and wait times are the daily scoreboard. When a headline coaster runs one train on a busy Saturday, the waits on this board show what it cost.
- Maintenance Director: Weather holds and mechanical downtime both cut ride availability, and the cause codes behind it decide which ones are maintenance's problem.
- Food and Beverage Director: Per capita figures that jump in a heat wave aren't a win to bank. This team needs them next to attendance to see what's price, what's mix and what's thirst.
- Season Pass and Guest Relations Managers: Complaints show trouble the same day, and NPS within the week. Renewals show it a year later, when it's far harder to fix.
Count lightning holds as lost minutes in ride availability, but give every hold a cause code. Leave weather out and a stormy July shows 96% while guests stand in dead queues. Put it in with no cause and maintenance takes the blame for the sky.
Dashboard Example Overview
The park sits outside a mid-sized city in the inland Southeast, with 38 rides, seven of them coasters, and six headline rides that carry most of the lines. It opens weekends from the last weekend of February, runs daily from late May to mid-August, holds a Halloween event through October and runs holiday lights from late November to the first weekend of January. Its season passes run 12 months from purchase. Nine KPIs:
- Theme Park Attendance: Paid, pass and comp visits through the gate, one per person per day. It has no target, since it follows the calendar: January is a few days of holiday lights and February a single opening weekend. It's here as the denominator for the per capita and per-visitor KPIs.
- Per Capita Spending: Admissions revenue (tickets, allocated pass revenue and parking) plus in-park revenue (food, merchandise, games and extra-charge rides), divided by attendance. It's the industry's standard spend measure and the one owners compare first.
- Food and Beverage Per Capita: Food and beverage revenue, drink plans included, divided by attendance. It's the in-park figure operations can move within a day.
- Top Ride Average Wait Time: Average measured wait across the six headline rides, sampled every 30 minutes while each is open, using timed cards rather than posted waits. Lower is better, up to a point.
- Ride Availability: Ride-minutes operated divided by ride-minutes scheduled across all 38 rides. Weather holds, breakdowns and late openings all count as lost time.
- Guest Net Promoter Score: The percentage of surveyed guests scoring 9 or 10 on likelihood to recommend, minus the percentage scoring 0 to 6, as Bain defines it.
- Season Pass Renewal Rate: Passes reaching the end of their 12-month term in the month that renew within 30 days, divided by passes reaching the end of term. It lags everything else by up to a year.
- Guest Complaints per 10k Visitors: Complaints logged by guest relations, email and the app, divided by attendance and multiplied by 10,000, so a quiet February and a packed July compare fairly.
- Ride Injuries per Million Attendees: Ride injuries needing more than ordinary first aid over the trailing 12 months, per million visits in the same 12 months. That's the IAAPA and National Safety Council definition, so it compares with their published rate.
Autumn 2024 was ordinary. October's Halloween event brought 174,360 visits, rides ran 96.5% of scheduled time and NPS was 44. Winter barely registered: January's 14,070 visits were four days of holiday lights, February's 8,050 the opening weekend.
The storms arrived in late May 2025, and availability slipped to 93.1%. June was worse. The park lost six full days to severe weather and spent most afternoons on lightning hold, and availability fell to 86.7%. July added a heat wave. Two coasters kept faulting in the heat, and availability bottomed at 85.2%. With fewer rides running, the headline rides averaged a 54.6-minute wait, against 41.4 minutes the October before, on 185,630 visits. Complaints reached 30.8 per 10,000 visitors and NPS fell to 18.
Two numbers looked healthy that July, for the wrong reasons. Per capita spending hit $62.99 and food and beverage per capita $19.03. Pass holders, who visit often and spend less each time, stayed home in the heat, and the day guests who came bought a lot of cold drinks.
In August the park tried to win people back. Any day guest could put the price of that day's ticket toward a heavily discounted 12-month pass, and about 2,800 people took the offer. Complaints eased to 21.9 per 10,000 in August and 13.2 in September. The cost would arrive a year later.
Over the winter the park changed three things. A lightning detection system now clears rides zone by zone, rather than holding the whole park on one radius, and inspection crews are staged so coasters reopen as soon as their checks finish. Two headline coasters got second trains for summer. Shade and misting fans went over the three longest outdoor queues, with free water stations beside them.
Summer 2026 brought ordinary weather, and some of the recovery is just that. Even so, July's availability held at 95.2% and the headline rides averaged 41.1 minutes, on 228,430 visits. Complaints were 12.3 per 10,000. NPS came back to 35, still short of its 40 target.
Not all of it went to plan. Food and beverage per capita fell to $15.93 in July 2026 and total per capita to $59.56, despite a 3% price rise. The free water stations cost some bottled water sales, as expected. The rest is pass holders coming back, which the park wanted, at a lower spend per visit.
The number that hasn't recovered is season pass renewal. It held near 58% before the storms, fell to 47.6% by September 2025 and sat at 46% to 47% all winter, because every pass coming due had lived through that summer. It climbed to 50.6% in July 2026, then dropped to 43.7% in August, the month the discounted compensation passes came due. Bargain buyers renew far less often. September ended at 50.3% against a 58% target, and the smaller pass base shows at the gate: March 2026 drew 73,430 visits against 76,060 a year earlier, and April 92,210 against 95,780.
Ride injuries stayed rare, which is why the rate needs care. Four in twelve months, one of them a guest who fainted at an unload platform after a long wait in the heat, put the trailing rate at 3.22 per million attendees in October 2025, above the IAAPA/NSC 2024 rate of 2.86. By September 2026 it was 2.28.
Creating a Theme Park Dashboard in SimpleKPI
-
Step 1 Settle what counts as a lost ride-minute
Sit operations and maintenance down together before the first month is recorded. Does a single-train day count as running? Is a ride closed all season for refurbishment in the schedule at all? Does a lightning hold count? This page says yes to the last and logs the cause, but whatever you choose, write it down, because ride availability means nothing if it's defined differently every summer.
The guide to choosing KPIs covers how to keep a set this small.
-
Step 2 Time the queues, don't trust the signs
Posted waits are estimates someone updates by hand, and a park that pads them to please guests flatters its own chart. Use timed cards handed out at the queue entrance, or virtual queue return times, on a fixed set of headline rides. Change the set only when a new ride opens, and note the month you did it.
-
Step 3 Give each number its system and its owner
Attendance comes from gate scans in the ticketing system, per capita figures from finance once ticket and point-of-sale revenue are reconciled, availability from the ride operations log, NPS from the survey tool, renewals from the pass system and injuries from the first aid and risk log. In season, the operations huddle reads availability and waits every morning. Guest relations reads complaints and NPS weekly, and the GM takes the whole board monthly.
-
Step 4 Plan for the months the gates are shut
A rate built on four days of holiday lights or one opening weekend will swing wildly, so compare January with last January, not with July. Use trailing 12-month figures for anything as rare as ride injuries. And don't stop reading renewals when the park closes, because passes still come due every month.
-
Step 5 Read per capita against the pass mix
Per capita falls when pass holders come back and rises when they stay home, so a per capita target can quietly push a park away from the guests who keep it full. Put per capita, attendance and renewal rate side by side, and treat a per capita jump in a bad-weather month as a warning, not a result.
List of Theme Park Guest Experience KPIs
Only ride injuries has a published North American benchmark, from IAAPA and the National Safety Council. Every other target is a starting point for a park of this size: reset it from your own seasons.
| KPI Name | Typical Target | Description / Calculation |
|---|---|---|
| Theme Park Attendance | None (context) | Paid, pass and comp visits through the gate, one per person per day. Compare with the same month last year. |
| Per Capita Spending | $58 (starting point) | Admissions revenue plus in-park revenue, divided by attendance. |
| Food and Beverage Per Capita | $15 (starting point) | Food and beverage revenue, drink plans included, divided by attendance. |
| Top Ride Average Wait Time | ≤ 40 minutes (starting point) | Average measured wait across the headline rides, sampled every 30 minutes while open. Lower is better. |
| Ride Availability | ≥ 96% (starting point) | Ride-minutes operated divided by ride-minutes scheduled, with weather holds counted and cause-coded. |
| Guest Net Promoter Score | ≥ 40 (starting point) | Percentage of promoters (9 to 10) minus percentage of detractors (0 to 6) from the post-visit survey. |
| Season Pass Renewal Rate | ≥ 58% (starting point) | Passes renewed within 30 days of term end divided by passes reaching term end in the month. |
| Guest Complaints per 10k Visitors | ≤ 12 (starting point) | Complaints logged divided by attendance, multiplied by 10,000. Lower is better. |
| Ride Injuries per Million Attendees | ≤ 2.86 (IAAPA/NSC North America rate, 2024) | Ride injuries needing more than ordinary first aid in the trailing 12 months, divided by trailing 12-month attendance, multiplied by 1,000,000. |
Want a ride-operations angle? Download eight daily theme park KPIs in Excel, each with a description, unit, direction and target. It's an older, ride-operations set: ride capacity utilization, ride downtime to recovery time, mobile app ride bookings and staff response time sit beside average ride wait time, per capita spend and a guest happiness score.
Why Theme Park Dashboards Matter
On a park's board the numbers fight each other, and the clearest fight is attendance against wait time. Fewer guests should mean shorter lines, but when rides go down the remaining lines grow, and the park in this example had longer waits on 185,630 visits in July 2025 than on 228,430 in July 2026. Wait time is a ride availability problem far more often than a crowd problem.
Spend pulls against loyalty. Pass holders lower per capita every time they visit, and a team chasing a per capita target can end up pricing them out, then wondering why spring weekends are thin. Food and beverage per capita pulls against guest welfare in the heat: free water costs drink sales, and it's still the right call when guests are fainting at the unload platform.
Recovery pulls against renewal, too. Cheap compensation passes calm guest relations in August and drag renewals down twelve months later. Neither is wrong, but someone has to decide it knowing both numbers. And reopening fast after a storm is worth chasing, but never by shortening the checks a coaster runs before guests board.
For another business where the forecast writes part of the plan, see the golf club example, or the boutique hotel example for a guest business with its own peaks. For a park, the practical step is concrete: before next May, agree your lightning hold rules and cause codes, decide which rides are headline rides, and put July 2025 and July 2026 on the same screen.
Building it in SimpleKPI
Build this dashboard yourself with SimpleKPI's KPI dashboards. The mechanics are the same whatever you track:
- KPIs: each one gets a target, an entry frequency and tags, so you can report by team, site, product or whatever you split the numbers by.
- Data: type numbers in, import a spreadsheet, or use an integration or the API. The dashboard updates as each number lands, so daily and monthly KPIs sit side by side.
- Reports: scheduled KPI reports email the numbers to people who never log in.
- AI: Kip, the built-in AI, suggests targets and flags indicative benchmarks (AI estimates, not peer data) once some history builds up.
- Price: $79 a month for unlimited users and KPIs, as one flat price, with a 14-day free trial and no card needed.