What is a Boutique Hotel Dashboard?
A boutique hotel dashboard is a visual display that brings a property's key numbers, such as occupancy, average daily rate, RevPAR and guest satisfaction, together on one screen. It shows how the property is performing against target in charts, gauges and trend lines, so anyone can see where the month stands without pulling figures from three systems first. Owners use it to watch profitability. Managers use it to balance rate, occupancy and cost day by day.
Overview
Hotel data scatters by nature. Bookings sit in the property management system, channel revenue with the online travel agents, payroll in the accounting package, and reviews across half a dozen sites. A dashboard puts the essentials in one view, and the relationships start to show. When occupancy climbs but RevPAR stays flat, rate is being sacrificed to fill rooms. When labor costs rise faster than revenue, you see it in the same view, not as a surprise at month end.
The same layout works for a single boutique property, a short-term rental portfolio, or a management company running properties on behalf of multiple owners. That last case is worth a moment. An owner who can check occupancy, RevPAR and EBITDA on a live dashboard asks fewer anxious questions than one waiting on a monthly PDF.
Who benefits from this dashboard?
- Owner-operators: the whole business on one screen, from this week's occupancy to the EBITDA line, with no finance team needed to prepare it.
- General managers: rate, occupancy and labor cost side by side. Balancing those three is most of the job in a small property.
- Property management companies: one dashboard per property with a consistent KPI set, so portfolio comparisons stay honest.
- Revenue and marketing staff: Revenue Per Channel and Social Media Engagement show whether the push for direct bookings is actually shifting the mix.
Dashboard Example Overview
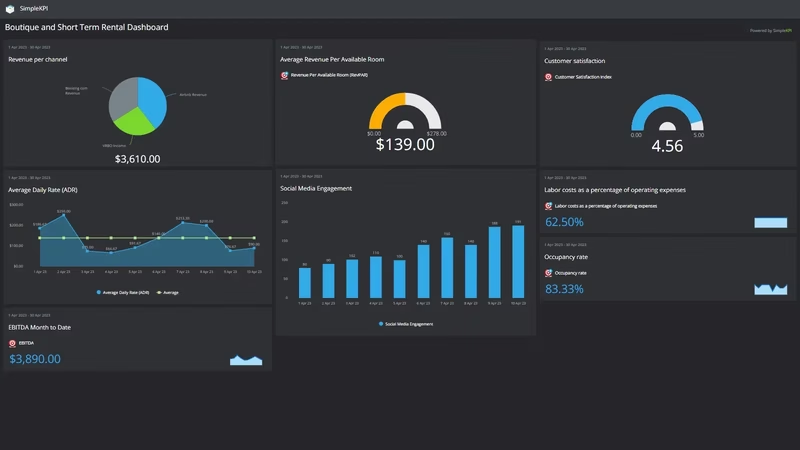
The dashboard pictured here tracks eight KPIs, grouped around four questions:
- Are we selling rooms at the right price? Occupancy rate, Average Daily Rate (ADR) and Revenue Per Available Room (RevPAR) form the classic hotel trio. ADR tells you what a sold room earns, occupancy tells you how many rooms sell, and RevPAR folds both into one number for the property.
- Is the business profitable? EBITDA carries the earnings picture, while Labor costs as a percentage of operating expenses keeps watch on the largest cost line in almost every hotel.
- Where do bookings come from? Revenue Per Channel splits income between direct bookings, OTAs and other sources, which is where commission costs hide.
- Will guests return and recommend us? Customer satisfaction and Social Media Engagement cover reputation, which for a boutique property is most of the marketing.
Eight KPIs is deliberately few. A small property doesn't need forty metrics. It needs the handful that change decisions, kept current, in a place where someone actually looks at them.
Read ADR, occupancy and RevPAR as a set. RevPAR drops when either of the other two slips, and seeing all three together tells you whether the fix is rate or volume.
Creating a Boutique Hotel Dashboard in SimpleKPI
-
Step 1 Decide what matters at your property
Start with the questions you ask every week: are rooms filling, at what rate, at what cost, and are guests happy? Pick one or two KPIs per question. If you want a considered starting list, this guide to boutique hotel KPIs for growth walks through the core set.
-
Step 2 Add your hotel KPIs
Create each KPI in SimpleKPI with its target and frequency. Occupancy and ADR are usually daily or weekly; EBITDA and labor cost are monthly. Tags keep things tidy by property or department, and plans include unlimited KPIs, so a growing portfolio changes nothing.
-
Step 3 Connect your data
Feed numbers in through spreadsheet imports, integrations or the API. Most properties start with a weekly export from the property management system and a monthly figure from accounting, then automate the pieces that prove worth automating.
-
Step 4 Build views for different audiences
A daily trading view for the front desk, a cost and earnings view for the owner, a channel mix view for whoever manages rates. Same data, different framing. Trend lines and KPI insights surface the slow movements, like a channel mix drifting toward commission-heavy bookings, that daily numbers hide.
-
Step 5 Share, review, adjust
Put the dashboard on a back-office screen, bring it to the weekly ops meeting, and let scheduled KPI reports carry the numbers to owners who won't log in. Kip, the built-in AI, can suggest targets and flag indicative benchmarks (AI estimates, not peer data) as your history builds. Drop any KPI that never changes a decision.
List of Boutique Hotel KPIs
The table below covers every KPI on the example dashboard. Targets are general guidance, and seasonality moves all of them. Your own baseline beats any generic range.
| KPI Name | Typical Target | Description |
|---|---|---|
| Average Daily Rate (ADR) | Trending up year on year | Room revenue divided by rooms sold. The cleanest read on pricing power, best judged against your own seasonal pattern. |
| Revenue Per Available Room (RevPAR) | Trending up year on year | Room revenue divided by rooms available, sold or not. Combines rate and occupancy into the single headline figure for the property. |
| Occupancy rate | 60-80% in season | The percentage of available rooms sold. Read it beside ADR; a full house at a giveaway rate isn't a win. |
| Labor costs as a percentage of operating expenses | Set from your baseline | Payroll and related costs as a share of total operating spend. Usually the biggest controllable cost, and the first place margins leak. |
| Customer satisfaction | 4.5+ on a 5-point scale | Guest scores from surveys and review platforms. In a boutique property, reputation is the growth engine. |
| EBITDA | Positive and growing | Earnings before interest, taxes, depreciation and amortization. The profitability line owners and lenders look at first. |
| Social Media Engagement | Trending up | Likes, shares, comments and follower growth across your channels. A leading indicator for direct bookings. |
| Revenue Per Channel | Direct share growing | Revenue split by booking source. Every point shifted from OTA to direct is commission saved. |
Why Boutique Hotel Dashboards Matter
Small hotels run on tight margins and thin management layers. The same person often sets rates, approves staff schedules and answers reviews, and that person rarely has an afternoon spare to assemble reports. A dashboard does the assembling once, then keeps doing it. That's exactly the kind of work worth automating.
The value compounds through connections. RevPAR alone says the month is soft; RevPAR next to occupancy and ADR says why. Labor cost next to occupancy shows whether staffing tracks demand or just habit. Revenue Per Channel next to Social Media Engagement shows whether the marketing effort produces bookings you keep the whole margin on.
And for anyone managing property on behalf of owners, the dashboard is quiet credibility. Numbers on demand, targets visible, trends honest. That conversation goes better than one built on a spreadsheet emailed a week after month end.
Build this dashboard yourself with SimpleKPI's KPI dashboards, and pay one flat price for unlimited users and KPIs.