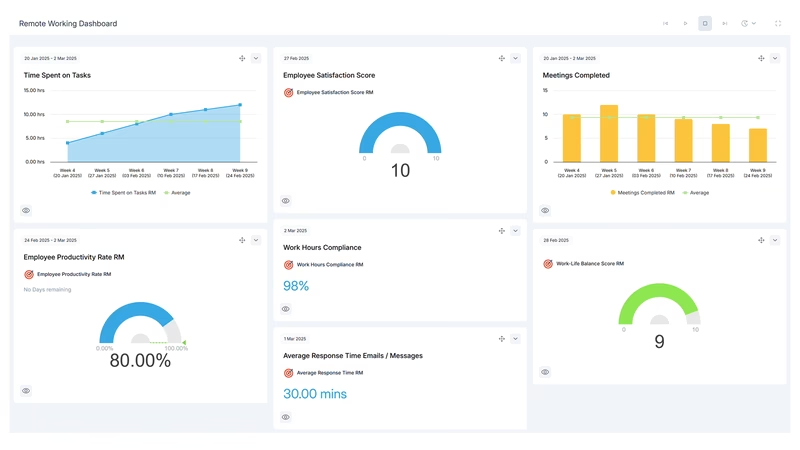
Remote Work Performance Dashboard
The monthly people review looks fine again. Meeting hours are up a quarter of an hour on last month, which is noise. Messages sent after hours are up half a point, also noise. Nobody in the room is wrong about any single month. It's only when someone puts twelve months on one chart that the line clearly slopes, and by then some of the best engineers are taking recruiters' calls.
Remote and hybrid work is now ordinary for office jobs. The Bureau of Labor Statistics put the 2025 telework rate at 22.4% of employed people, and 44.9% in professional and business services. The WFH Research survey run by Barrero, Bloom and Davis found 26.8% of full paid working days were worked from home in September 2026, and among full-time employees, 30.0% were hybrid and 12.1% fully remote.
The workday has grown at the edges. Microsoft's 2025 Work Trend Index, built from aggregated and anonymized Microsoft 365 signals, found meetings after 8pm up 16% year over year, and the average employee sending or receiving more than 50 messages outside core business hours. That kind of change rarely shows in one month. It shows in a trend line.
For this example we invented a company: a US software business of about 330 to 355 people selling job-costing software to construction contractors, with small hub offices in Denver and Austin. Its monthly figures are modeled. None of the targets here has a published benchmark behind it, because nobody publishes comparable meeting-hour or response-time data across companies, so treat every target as a starting point.
What is a Remote Working KPI Dashboard?
Overview
A remote working KPI dashboard shows whether distributed teams deliver what they commit to without the workday leaking into evenings, and whether the people doing it stay.
Commitments come first. Team goal completion is the share of milestones due this month that landed on time. It's the closest thing a remote company has to an output measure that works across engineering, sales and support.
Next comes the cost of coordinating at a distance. Meeting hours per person per week shows how much of the week goes to calls. Cross-team response time shows how long a request sits when the person who can answer is two time zones away or in back-to-back meetings. After-hours activity share shows whether the work still fits in the day.
The people measures follow. A monthly eNPS pulse moves first. New-hire time to productivity shows how well onboarding works when nobody can overhear the team. Regrettable attrition comes last and costs the most.
Office utilization on anchor days and the work-from-home rate sit underneath as context, so a summer dip in office use isn't mistaken for a problem.
Some numbers are left off on purpose: keystrokes, mouse movement, screenshots, green "active" dots and hours logged in. They measure presence, people learn to game them within weeks, and they cost you the trust the rest of the board depends on. Every activity number here is aggregated by team from calendar and message metadata, and never shown per person.
Who benefits from this dashboard?
- Head of People: eNPS and regrettable attrition are the numbers the leadership team asks about. The drift in meeting hours and after-hours share warns them about both, months earlier.
- Team Leads: They see their own team's meeting hours and after-hours share against the company line, which makes the recurring meeting nobody needs much easier to cancel.
- VP of Engineering or Operations: Goal completion next to cross-team response time shows whether delivery is slipping inside teams or in the handoffs between them.
- Hiring Managers: Time to productivity by start month tells them whether a remote new hire is getting enough of the team's attention to ramp up.
- Workplace Manager: Anchor-day office utilization is the evidence for the next lease decision, whether that means a smaller floor or more booking rules.
Count after-hours activity in each sender's own time zone. Measure it against the Denver hub's clock and a Pacific-time engineer finishing at 5pm shows as working late every day, while an East Coast lead still messaging at 7pm local looks like they logged off on time.
Dashboard Example Overview
About 60% of the company works fully remote across more than 30 states. The rest are hybrid, using 120 desks in the two hubs on Tuesday and Wednesday anchor days. People ops reports nine KPIs monthly:
- Team Goal Completion Rate: Team milestones and key results due in the month that were delivered by their due date, divided by milestones due. Milestones are set at quarterly planning, so the denominator can't be quietly shrunk mid-month.
- Meeting Hours per Person per Week: Scheduled meeting hours attended, from calendar metadata, divided by headcount and by weeks in the month. Focus blocks and canceled meetings are excluded.
- After-Hours Activity Share: Messages sent outside the sender's own local working hours, divided by all messages sent. Reported only for teams of five or more.
- Cross-Team Response Time: Median business hours from a request landing in another team's request channel or queue to the first human reply. Bots and auto-acknowledgments don't count.
- Employee Net Promoter Score: The percentage of pulse respondents scoring 9 or 10 on "How likely are you to recommend working here?", minus the percentage scoring 0 to 6. It runs from -100 to 100.
- Regrettable Attrition Rate: Voluntary leavers the company wanted to keep in the last 12 months, divided by average headcount over the same 12 months. The manager flags it when the person resigns, before the exit interview.
- New-Hire Time to Productivity: Average calendar days from start date to the first piece of work a new hire delivers on their own and their manager signs off, for hires who reached it that month.
- Office Utilization Rate: Average desks occupied on anchor days, from desk booking and badge data, divided by the 120 desks available.
- Work-from-Home Rate: Paid workdays worked from home divided by all paid workdays. It has no target. It's here so office utilization and after-hours share are read against how the company actually works.
In October 2024 the company looks healthy. Meeting load is 9.9 hours per person per week, 9.2% of messages go out after hours, other teams get a first reply in 3.6 business hours, and 85.3% of team milestones land on time. eNPS is 25, and new hires reach their first solo deliverable in 63 days.
Then it creeps. Meetings dip to 9.6 hours over the December holidays, so January's 10.7 looks like everyone getting back to work. After that it goes 10.6, 10.9, 11.2, 11.4, 11.8. Apart from January, no month adds more than 0.4 hours, and the monthly review compares each month with the one before. A new product line, new dependencies between teams and a standing sync for each of them add a few tenths at a time.
By August 2025, the drift has reached everything downstream. After-hours share is 14.4%, cross-team response time is 6.1 hours, goal completion is 75.8% and eNPS is 10. The number the leadership team actually watched looked fine. Regrettable attrition was 4.8% in May 2025 and 5.9% in August, both under the 6% target.
That August, a people-ops analyst preparing the annual engagement survey puts the last eleven months of meeting hours on one chart with a trend line. It climbs about 0.2 hours a month, from 9.9 to 12.0. Across 341 people, that's about 716 extra hours of meetings a week. On the same chart, new-hire time to productivity has gone from 63 to 82 days.
The changes, from September 2025, are mostly calendar rules. Every recurring meeting expires after 90 days unless its owner renews it. Each team swaps two standing status calls for a written Monday update. Live meetings move into a shared window, noon to 4pm Eastern, 9am to 1pm Pacific. Messages to someone outside their working hours default to scheduled send. New hires get a buddy in their own time zone and a named first deliverable on day one.
The activity numbers turn first, and slowly. Meeting hours read 11.9 in September and October 2025 and 11.0 over the holidays, then bounce to 11.6 with January planning before easing to 10.6 in May and 9.8 in August 2026. After-hours share falls from a peak of 14.7% in September 2025 to 11.8% in March and 9.8% in September 2026. Cross-team response time is back to 4.0 hours. Goal completion, 73.6% at its low in September 2025, reaches 85.2% in September 2026, the first month at target in almost two years.
The people numbers trail the activity numbers by a season. eNPS bottoms at 8 in October 2025, reaches 17 in February and 21 in September 2026. Time to productivity peaks at 91 days in November 2025, for people who started in the summer and spent their first weeks with managers in back-to-back calls. It's 70 days by September 2026, still short of the 65-day target.
Regrettable attrition moves the wrong way after the fix. It climbs from 6.5% in September 2025 to 8.7% in March 2026, and it's still 7.7% in September 2026. People who decided to leave during the summer of long days resigned over the winter, and a 12-month rolling rate carries those departures until spring 2027. Office utilization never reaches its 60% target either, ranging from 47.5% in December 2025 and July 2026 to 57.5% at best. The company chose not to add a third anchor day. With the work-from-home rate steady at about 82% and engagement recovering, forcing attendance would have fixed the wrong number.
Creating a Remote Working Dashboard in SimpleKPI
-
Step 1 Set the privacy rules before the first chart
Decide what's counted, at what level, and who sees it, then tell everyone. Team level only, a minimum group of five, metadata rather than message content, and no individual activity scores. A remote team that suspects it's being watched will change its behavior around the measurement, and the trend line stops meaning anything.
Still choosing which measures make the cut? The guide to choosing KPIs goes deeper.
-
Step 2 Pin down the definitions that time zones break
After-hours is counted in the sender's local time. Response time runs in the responder's business hours, or a request sent from Boston at 3pm counts against an Oregon team that's still at lunch. Decide whether one-to-ones count as meetings (here they do) and agree each new hire's first deliverable when they start, so "productive" isn't decided after the fact.
-
Step 3 Give each number one owner and one system
Meeting hours, after-hours share and response time come from calendar, chat and request-queue metadata, owned by whoever runs people analytics. Goal completion comes from the planning tool and belongs to team leads. eNPS is HR's survey. The regrettable flag sits in the HR system, set by the manager on the day someone resigns, because asked later almost every departure becomes regrettable.
-
Step 4 Flag four months of drift in one direction
Keep the monthly review, and add a quarterly one that looks only at 12-month trend lines for meeting hours, after-hours share and response time. A simple rule helps: flag any of the three that has moved the same way four months running, however small each step was.
List of Remote Working KPIs
None of these targets has a published cross-company benchmark, so all are this example's starting points. Set your own from a year of your own history.
| KPI Name | Typical Target | Description / Calculation |
|---|---|---|
| Team Goal Completion Rate | ≥ 85% (starting point) | Team milestones due in the month delivered by their due date divided by milestones due. |
| Meeting Hours per Person per Week | ≤ 10 hours (starting point) | Scheduled meeting hours attended divided by headcount and by weeks in the month. Lower is better. |
| After-Hours Activity Share | ≤ 10% (starting point) | Messages sent outside the sender's local working hours divided by all messages sent. Teams of five or more. Lower is better. |
| Cross-Team Response Time | ≤ 4 business hours (starting point) | Median business hours from a request reaching another team to the first human reply. Lower is better. |
| Employee Net Promoter Score | ≥ 20 (starting point) | Percent of respondents scoring 9 or 10 minus percent scoring 0 to 6 on recommending the company as a place to work. |
| Regrettable Attrition Rate | ≤ 6% (starting point) | Voluntary leavers the company wanted to keep over the last 12 months divided by average headcount over the same period. Lower is better. |
| New-Hire Time to Productivity | ≤ 65 days (starting point) | Average days from start date to the first solo deliverable signed off by the manager. Lower is better. |
| Office Utilization Rate | ≥ 60% (starting point) | Average desks occupied on anchor days divided by desks available. |
| Work-from-Home Rate | No target (context; US rate 26.8% of paid days, WFH Research, Sept 2026) | Paid workdays worked from home divided by all paid workdays. |
For a wider look at measuring distributed teams, our post on KPIs for remote work covers more options. If your board sits with HR, the human resources dashboard example covers hiring, turnover and absence for a whole workforce, and the KPI generator can suggest measures for a team this page doesn't cover.
Why Remote Working Dashboards Matter
In an office, a manager sees the meeting room that's always booked and the team that's still there at 7pm. Remote, those signals don't exist unless something collects them. So most remote companies run on lagging numbers: the engagement survey once a year, and resignations as they come.
These nine pull against each other in ways a single number hides. Cut meetings hard and cross-team response time can get worse, because the questions that were answered in the standing call now wait in a queue. That's why this company replaced its status calls with written updates instead of just deleting them. Goal completion can be propped up by working late, so it only counts as good news when after-hours share is flat. Fewer meetings help most people but can slow new hires, who pick up context in those calls, which is what the onboarding buddy is for. And pushing office utilization up with a third mandated day tends to move the commute into the workday and the work into the evening.
Trust is part of it too. Gallup found in 2025 that only 54% of managers who supervise remote workers strongly agreed they trust their teams to be productive remotely. Activity tracking feeds that doubt. A board built on delivery, coordination cost and retention gives a doubting manager something better to look at.
Start with one chart. Put a 12-month trend line on meeting hours per person and look at the slope. If it's climbing a fifth of an hour a month, the monthly review won't have told you. Your regrettable attrition rate will, about two quarters from now.
Building it in SimpleKPI
Build this dashboard yourself with SimpleKPI's KPI dashboards, or start from the Human Resources KPIs template. The mechanics are the same whatever you track:
- KPIs: each one gets a target, an entry frequency and tags, so you can report by team, site, product or whatever you split the numbers by.
- Data: type numbers in, import a spreadsheet, or use an integration or the API. The dashboard updates as each number lands, so daily and monthly KPIs sit side by side.
- Reports: scheduled KPI reports email the numbers to people who never log in.
- AI: Kip, the built-in AI, suggests targets and flags indicative benchmarks (AI estimates, not peer data) once some history builds up.
- Price: $79 a month for unlimited users and KPIs, as one flat price, with a 14-day free trial and no card needed.