The Case for OKRs
When you’re not working toward clear objectives and simply relying on completing the daily tasks, your business, team, or department is undoubtedly failing to achieve its real potential.
Your teams and individuals can work as hard as they like, but without clear goals to guide them, their efforts are at best scattered and unfocused.
Time and again, this absence of direction often results in missed opportunities, wasted resources, and ultimately, in the worst-case scenario, can be a real danger to the company's future.
You may already have heard of Objectives and Key Results (OKRs). It’s a proven framework for setting and achieving your goals, but without proper tracking, even the best strategies can falter.
This is where OKR dashboards become indispensable to help you live up to your true potential.
They are a proven goal-setting tool that has enabled companies like Google, Intel, and Oracle to achieve astonishing growth goals
So, in this guide, we’ll cover the essentials of OKR dashboards, from the basics to advanced strategies, helping you utilize these tools to improve your goal-tracking process and attain superior results.
What is an OKR Dashboard?
An OKR dashboard is such a valuable tool that makes it easy to visualize the progress of your Objectives and Key Results (OKRs). It brings together your goals and performance metrics in one simple, centralized view. With this dashboard, you get real-time insights into how your organization is progressing toward its strategic objectives, helping teams to quickly see which goals are right on track and which ones might need a little extra attention.
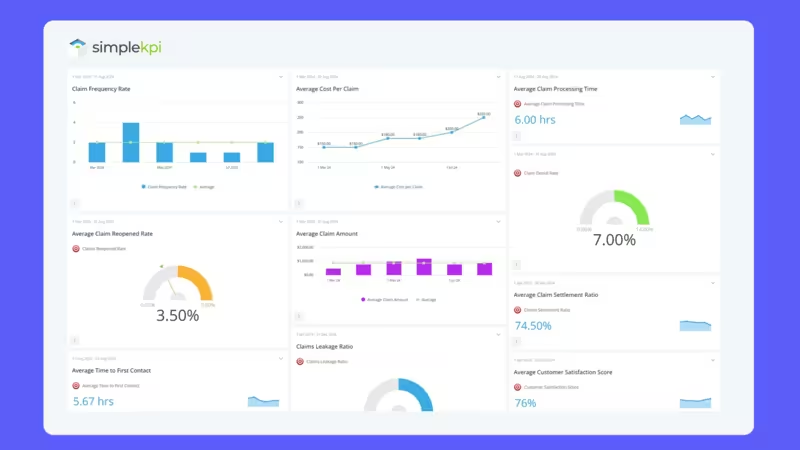
For example, let's take a marketing team. They aim to boost brand awareness and would benefit from an OKR dashboard to track key metrics like website traffic and that all-important social media engagement.
Similarly, if you have a product development team, they can monitor milestones for a new feature launch, ensuring that deadlines are met and, in turn, keeping your high customer satisfaction standards.
Regularly update your OKR dashboard to ensure that the data reflects the current business environment, allowing for timely decisions and adjustments.
The benefits of using an OKR Dashboard
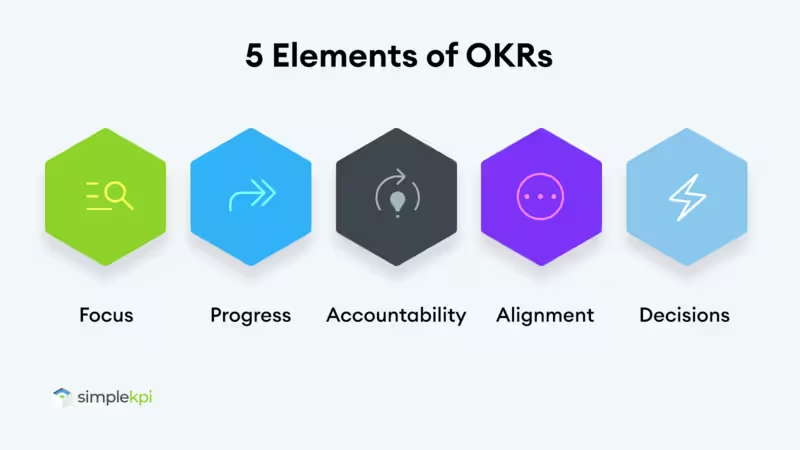
An OKR dashboard is a strategic tool that enhances focus, alignment, and accountability by visualizing Objectives and Key Results in real-time.
Enhanced Focus and Clarity
An OKR dashboard visually represents your goals, helping teams stay focused and aligned with company priorities. Clear goals lead to higher engagement and productivity, as noted by a Zensai article on goal setting and productivity.
Real-Time Progress Tracking
Monitor progress in real-time, allowing for quick adjustments and keeping teams agile. Google’s use of OKR dashboards is a prime example of maintaining growth through real-time tracking.
Improved Accountability
Transparency in OKR dashboards fosters accountability, encouraging ownership of goals. A Gallup report highlights how accountability boosts performance.
Alignment Across the Organization
OKR dashboards align individual and team goals with company objectives, ensuring cohesive efforts and strategic focus across departments.
Data-Driven Decision Making
OKR dashboards provide data that guide informed decisions, helping leaders allocate resources effectively and achieve long-term success, as demonstrated by Intel’s strategic use of OKRs.
How to Create an OKR Dashboard: A Step-by-Step Guide
Creating an effective OKR (Objectives and Key Results) dashboard can greatly enhance your team's ability to stay focused and aligned with your organization's goals. Here’s a step-by-step guide to help you build a powerful OKR dashboard:
-
Define Your Objectives
- Identify Key Objectives: Start by clearly defining your organization's top priorities. These objectives should be ambitious yet achievable, providing a clear direction for your team.
- Ensure Alignment: Make sure each objective aligns with your company’s overall mission and vision, ensuring that every effort contributes to the bigger picture.
-
Determine Key Results
- Quantifiable Outcomes: For each objective, identify 3-5 key results that are measurable and specific. These should serve as indicators of progress towards achieving the objective.
- Set Benchmarks: Establish clear benchmarks and deadlines for each key result to track progress over time.
-
Select Relevant Metrics
- Identify Core Metrics: Choose metrics that directly relate to your key results. These could include sales growth, customer satisfaction scores, or employee engagement levels.
- Use Leading and Lagging Indicators: Incorporate both leading indicators (predictive metrics) and lagging indicators (historical data) to provide a complete view of performance. Mre infomration on setting OKR goals can be found from the Google OKR Playbook
-
Choose the Right Tools
- KPI Software: Utilize KPI or OKR tracking software like SimpleKPI to streamline the process. Look for features like customizable dashboards, real-time data integration, and automated reporting.
- Visualization Tools: Select visualization tools that present data clearly and effectively, such as bar charts, line graphs, and progress trackers.
-
Design Your Dashboard
- User-Friendly Layout: Design a dashboard that is intuitive and easy to navigate. Group related metrics together, use color coding to highlight progress, and avoid clutter.
- Interactive Elements: Incorporate interactive features like drill-downs and filters, allowing users to explore data in greater detail.
-
Implement and Share
- Rollout: Once your dashboard is ready, share it with relevant stakeholders. Provide training or documentation if necessary to ensure everyone can use it effectively.
- Set Access Levels: Control who can view and edit the dashboard, ensuring data integrity and security.
-
Monitor and Refine
- Regular Reviews: Schedule regular check-ins to review the dashboard’s performance. Are the key results being met? Are there any areas for improvement?
- Update as Needed: Be prepared to make adjustments to the dashboard as goals evolve, ensuring it remains a valuable tool for your team.
Make sure the dashboard is easy to navigate, allowing team members to drill down into specific objectives or key results as needed.
OKR Dashboard Examples and Templates
If you're new to OKRs, or just looking to refine your existing processes, having access to well-designed examples and templates can make a significant difference.
Below, we explore some practical OKR dashboard examples and provide a few templates to help you get started.
Basic OKR Dashboard
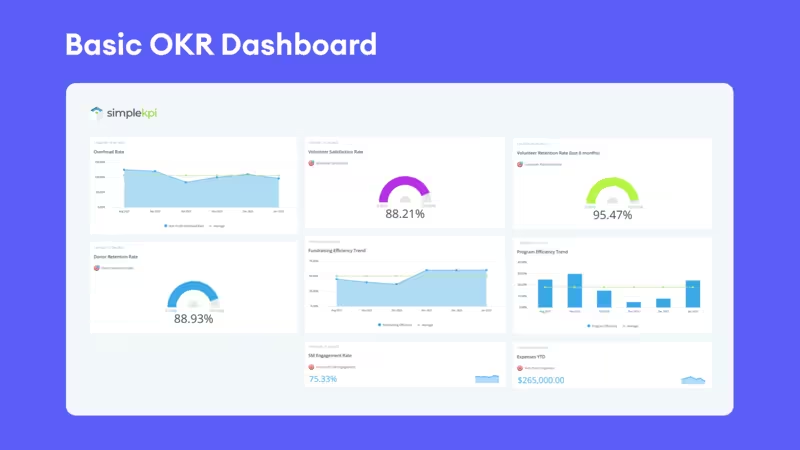
Overview: This simple dashboard focuses on the essentials, providing a clear snapshot of your objectives and key results. It’s ideal for small teams or startups that need to track progress without getting bogged down in too much detail.
- Objective Summary: A brief description of each objective.
- Key Results Tracking: Progress bars showing the completion percentage of each key result.
- Weekly Updates: Space for weekly status updates or comments.
Team Alignment OKR Dashboard
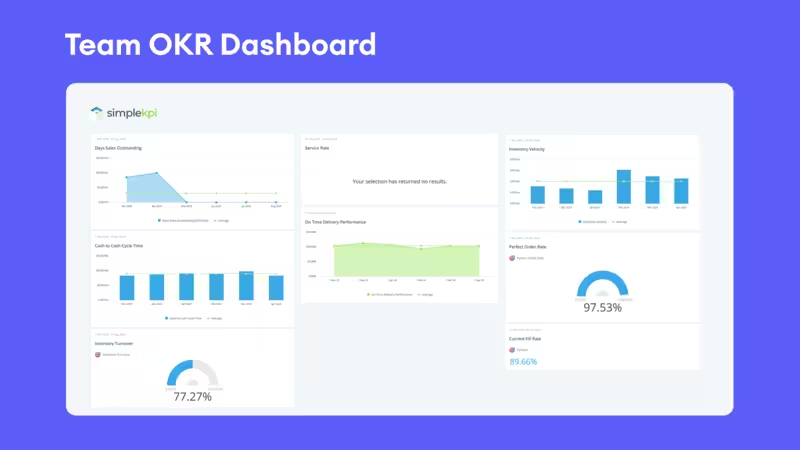
Overview: This dashboard is designed to ensure that every team member’s goals align with the broader company objectives. It’s particularly useful for larger teams or departments where coordination is critical.
- Objective Alignment: Visuals showing how each team’s objectives align with company-wide goals.
- Individual Key Results: Detailed tracking of each team member’s key results.
- Collaboration Features: Sections for team discussions and shared updates.
Project-Based OKR Dashboard
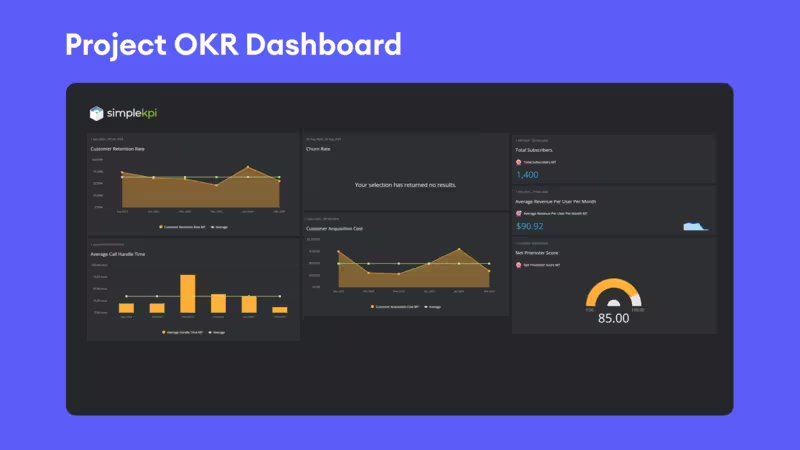
Overview: Perfect for project teams, this dashboard helps track objectives and key results on a project-by-project basis. It’s designed to keep project goals clear and ensure that everyone is on the same page.
- Project Objectives: Clearly defined objectives specific to the project’s success.
- Key Results Timeline: Timeline view of key results with deadlines and milestones.
- Resource Allocation: Visual representation of resource allocation against project goals.
Best Practices for Effective OKR Dashboards
Creating an OKR dashboard that truly enhances your team's performance involves more than just displaying data. Here are some best practices to ensure your OKR dashboard is as effective as possible:
1. Align with Company Goals
- Ensure that all objectives on the dashboard are directly aligned with the broader company goals. This keeps everyone focused on what truly matters. - Measure What Matters: How Google, Bono, and the Gates Foundation Rock the World with OKRs
2. Keep it Simple and Focused
- Avoid clutter by limiting the number of metrics and visuals on the dashboard. Focus on the most critical objectives and key results to avoid overwhelming users with too much information.
3. Use Clear and Consistent Visuals
- Use visual elements like progress bars, charts, and color coding consistently across the dashboard. This helps users quickly interpret data and understand progress at a glance.
4. Update Regularly
- Make sure the dashboard is updated regularly to reflect the latest data. This keeps the dashboard relevant and ensures that teams are working with the most current information.
5. Incorporate Real-Time Data
- If possible, integrate real-time data feeds into your dashboard. This allows teams to monitor progress and make adjustments on the fly, improving agility and responsiveness.
6. Provide Context for Metrics
- Always include context for each metric, such as benchmarks or targets. This helps users understand whether the current performance is on track, ahead, or behind schedule.
7. Enable Customization
- Allow users to customize their view of the dashboard based on their role or needs. This personalization can help different teams focus on the metrics that matter most to them.
8. Encourage Collaboration
- Use the dashboard as a tool for collaboration by including spaces for comments or notes. This can foster team discussions and ensure everyone is aligned on next steps.
Keep the dashboard streamlined by limiting the number of metrics and visuals.
Common Mistakes to Avoid
While OKR dashboards can be a powerful tool for driving performance and alignment, there are some common mistakes that can undermine their effectiveness.
Even at companies like Google, OKRs can sometimes lead to unintended consequences. For instance, when Google set an objective to increase user engagement, one key result focused on boosting clicks per user. Teams became overly focused on this metric, leading to changes that increased clicks but frustrated users, ultimately harming the user experience. This highlights the danger of prioritizing metrics over meaningful outcomes.
Lesson: It’s crucial to balance quantitative key results with qualitative assessments to avoid such pitfalls. So, Here are key pitfalls to watch out for and how to avoid them:
1. Setting Too Many Objectives
- Mistake: Trying to achieve too many objectives at once can dilute focus and make it difficult for teams to prioritize.
- Solution: Limit the number of objectives to 3-5 per team or department. This ensures that efforts are concentrated on what truly matters.
2. Vague or Non-Measurable Key Results
- Mistake: Defining key results that are too broad or not quantifiable makes it hard to track progress effectively.
- Solution: Ensure that each key result is specific, measurable, and time-bound. This clarity helps teams understand exactly what success looks like.
3. Neglecting to Update the Dashboard Regularly
- Mistake: An outdated dashboard provides inaccurate information, leading to poor decision-making and reduced accountability.
- Solution: Establish a regular update schedule, ideally weekly or bi-weekly, to keep the dashboard current and relevant.
4. Overcomplicating the Dashboard
- Mistake: Including too many metrics or overly complex visuals can overwhelm users and obscure important insights.
- Solution: Keep the dashboard simple and focused on the most critical metrics. Use clean, straightforward visuals to make data easy to interpret.
5. Ignoring User Feedback
- Mistake: Failing to consider the needs and preferences of the end-users can result in a dashboard that is not user-friendly or effective.
- Solution: Gather feedback from users regularly and be willing to make adjustments to improve usability and relevance.
6. Lack of Alignment Between Teams
- Mistake: If different teams or departments have dashboards that aren’t aligned with each other or the overall company goals, it can lead to conflicting priorities.
- Solution: Ensure that all teams’ dashboards are aligned with the company's strategic objectives and that there is transparency across departments.
7. Overemphasizing Metrics Over Outcomes
- Mistake: Focusing too much on metrics can lead to a “checklist” mentality, where hitting the numbers becomes more important than achieving meaningful outcomes.
- Solution: Balance quantitative metrics with qualitative assessments. Make sure that key results truly reflect the success of the objectives, not just numerical targets.
Overloading the dashboard with too many metrics or complex visuals can confuse users and obscure key insights.
Case Study: LinkedIn's Successful Use of OKR Dashboards
Background:
LinkedIn, the professional networking giant, implemented OKRs to drive alignment and focus across their rapidly growing organization. As the company expanded, leadership recognized the need for a structured approach to setting and tracking goals that would maintain alignment across teams and departments.
Implementation:
LinkedIn adopted OKRs to create clear objectives and measurable key results that aligned with the company's overall mission. They utilized OKR dashboards to visualize progress, track performance, and ensure transparency across all levels of the organization. These dashboards allowed teams to see how their individual and team goals connected to broader company objectives.
Outcome:
The use of OKR dashboards at LinkedIn helped improve focus and accountability. Teams could easily track their progress, identify areas needing attention, and celebrate achievements as they occurred. The transparency provided by the dashboards fostered better communication and collaboration, ensuring that everyone was aligned toward the company’s strategic goals. This approach was instrumental in LinkedIn's ability to scale effectively while maintaining strong performance and alignment across the organization.
Lesson Learned:
LinkedIn's success with OKRs underscores the importance of having clear, measurable goals that are regularly tracked and reviewed. The visual nature of the OKR dashboards made it easier for teams to stay aligned and focused, contributing to LinkedIn's continued growth and success.
References:
How LinkedIn Achieved Success with OKRs
The LinkedIn Playbook for Success with OKRs

A KPI dashboard tracks ongoing performance metrics that measure the health of business processes, while an OKR dashboard focuses on ambitious, time-bound goals driving strategic change. KPIs monitor stability, whereas OKRs push for improvement, making OKR dashboards more dynamic and goal-oriented.
OKRs, or Objectives and Key Results, are a goal-setting framework that helps organizations define and track their strategic objectives. The "Objective" is a clear, ambitious goal, while the "Key Results" are specific, measurable outcomes that indicate progress toward that goal. OKRs align teams and drive focus, ensuring that everyone is working toward the same high-impact objectives.
The five elements of OKRs include the Objective, which is a clear, ambitious goal; Key Results, which are specific, measurable outcomes tracking progress toward the objective; Initiatives, the tasks needed to achieve those key results; a Time Frame, typically a quarter, during which the OKRs are pursued; and Alignment, ensuring that OKRs across teams support overall business goals.
Track KPIs like these on SimpleKPI's KPI dashboards, with one flat price for unlimited users and a 14-day free trial.