What is a Law Firm Dashboard?
A law firm dashboard is a visual display that brings a firm's key performance indicators, such as billable hours, realization rate, profit margin and client retention, together on one screen. It shows performance against target in charts and gauges, so partners can see where the firm stands without waiting for the month-end pack. Practice managers use it to run operations week to week. Partners use it to check that the work being done is actually turning into cash.
Overview
Running a successful law firm means balancing client outcomes with business performance. The awkward part is that the numbers live in different systems: hours in the time-recording tool, invoices in the practice management system, client feedback in a spreadsheet somebody updates when they remember. A dashboard puts them side by side, and the connections start to show. When utilization dips, you can see the revenue that will sag a month or two later.
Law adds a complication most industries don't have. An hour of work has to survive three stages before it becomes revenue: it has to be recorded, it has to be billed at something close to full value, and the invoice has to be paid. Realization rate and collection rate measure the second and third stages. Small leaks at each stage compound quietly, which is why a firm can be busy and still miss its numbers.
Most law firm dashboards lean one of three ways:
- Financial dashboards track revenue per lawyer, profit margin and matter values. The managing partner's view.
- Productivity dashboards follow billable hours and timekeeper utilization, usually broken down by fee earner or practice group.
- Client dashboards watch satisfaction, retention and the cost of winning new work.
The example on this page mixes all three, which suits a partner or practice manager who wants one place to watch the whole firm.
Who benefits from this dashboard?
- Managing partners: revenue per lawyer, profit margin and average matter value in one view. That's the financial health of the practice at a glance.
- Practice managers: billable hours and timekeeper utilization show whether capacity is being used, and where work is piling up unevenly across the team.
- Finance and billing teams: realization and collection rates show exactly where value leaks between timesheet and bank account.
- Business development: client acquisition cost sitting next to retention rate settles the question of whether growth spending pays for itself.
Dashboard Example Overview
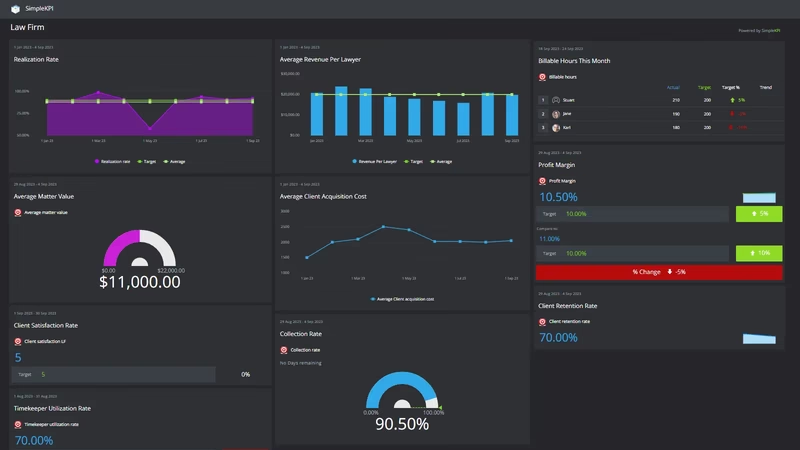
The dashboard pictured here is a dark-themed law firm board built in SimpleKPI. It tracks ten KPIs, grouped around four questions:
- Is the firm making money? Revenue per lawyer, Profit margin and Average matter value give the headline financials and show whether growth is coming from more matters or better ones.
- Are we billing what we work? Billable hours, Timekeeper utilization rate, Realization rate and Collection rate follow each hour from timesheet to invoice to cash.
- Are clients staying? Client satisfaction and Client retention rate track the relationships that produce repeat instructions and referrals.
- What does growth cost? Client acquisition cost keeps marketing and business development spend honest against the clients it actually brings in.
Nothing here needs exotic data. Every KPI can be produced from records the firm already keeps: timesheets, billing runs, the client file and a short satisfaction survey.
Put Billable hours, Realization rate and Collection rate on the same view. When hours climb but cash stays flat, the leak is in billing or collections, not effort.
Creating a Law Firm Dashboard in SimpleKPI
-
Step 1 Map the path from hour to cash
Write down the stages work passes through in your firm, from instruction to collected fee, and pick the measure that matters at each one. If you're starting from a blank page, this comprehensive guide to KPI dashboards covers the groundwork.
-
Step 2 Add your law firm KPIs
Create each KPI in SimpleKPI with its target and frequency. Ratio KPIs like realization and collection rate are built from two inputs, and this guide to formula-based KPIs shows how. Tags keep things organized by fee earner, practice group or office.
-
Step 3 Connect your data
Feed numbers in through spreadsheet imports, integrations or the API. Hours usually arrive daily from time recording, while billing and financial figures land with the month-end run. The dashboard updates as each arrives.
-
Step 4 Build views for different audiences
A utilization view for practice managers, a billing funnel for finance, a one-page financial summary for the partners' meeting. Same data, different framing, and nobody sits through numbers that aren't theirs.
-
Step 5 Share, review, adjust
Bring the dashboard to partner meetings and let scheduled KPI reports carry the numbers to people who won't log in. Kip, the built-in AI, can suggest targets and flag indicative benchmarks (AI estimates, not peer data) as your history builds. Retire any KPI nobody acts on.
List of Law Firm KPIs
The table below covers every KPI on the example dashboard. Targets are general guidance. Your own baseline beats any generic range.
| KPI Name | Typical Target | Description |
|---|---|---|
| Revenue per lawyer | Trending up year on year | Total fee income divided by fee earners. The cleanest single measure of whether the firm is growing productively. |
| Profit margin | 25-40% | Profit as a share of revenue. Read it beside revenue per lawyer to separate real growth from expensive growth. |
| Client satisfaction | 8 or above out of 10 | Survey-based score of how clients rate the firm's service. A leading indicator for retention and referrals. |
| Billable hours | Set per role and seniority | Hours recorded against client matters. The raw material every other financial number is made from. |
| Realization rate | 85% or higher | The share of recorded hour value that actually gets billed. Write-offs and discounts show up here first. |
| Client acquisition cost | Stable or falling | Marketing and business development spend divided by new clients won. A rising cost per client is an early warning. |
| Client retention rate | Above 90% | The percentage of clients who instruct the firm again. Repeat work is the cheapest revenue a firm has. |
| Average matter value | Set from your baseline | Average fee income per matter. Shows whether the firm is winning bigger work or slicing the same work thinner. |
| Timekeeper utilization rate | Set from your baseline | Billable hours as a share of available hours per timekeeper. Low utilization means capacity is paid for but not used. |
| Collection rate | 90% or higher | Cash collected as a share of amounts billed. The final stage of the journey from hour worked to money in the bank. |
Why Law Firm Dashboards Matter
Law firms sell time, and time leaks. Hours go unrecorded, recorded hours get written down, bills sit unpaid for months. Each leak looks small on its own. A dashboard that shows billable hours, realization and collection side by side makes the total cost of those leaks visible, and visible problems get fixed.
The financial numbers are lagging indicators. By the time profit margin disappoints, the causes are a quarter old: utilization slipped, a big client quietly left, write-offs crept up. A dashboard that pairs the lagging numbers with leading ones, such as satisfaction, utilization and acquisition cost, gives partners time to act while the year can still be steered.
There's a cultural effect too. When the numbers sit on a shared screen instead of buried in a month-end pack, the partner meeting shifts from working out what happened to deciding what to do about it. That shift alone usually repays the setup time.
Build this dashboard yourself with SimpleKPI's KPI dashboards, and pay one flat price for unlimited users and KPIs.