
Most KPIs are not standalone figures. They’re often calculated from multiple data points.
Revenue per employee, customer retention rate, profit margin: these are formulas, not raw numbers. Understanding how KPIs are built using formulas can surface deeper insights and drive smarter decisions.
In this post, I’ll cover:
- What calculated KPIs are
- Why formulas enhance your KPI tracking
- Step-by-step guide to creating calculated KPIs
- How to do it in SimpleKPI (with a video tutorial)
What Are Calculated KPIs?
A calculated KPI is one that is derived from existing metrics using a formula. For example:
- Customer Retention Rate = ((End Customers - New Customers) / Start Customers) × 100
- Revenue per Employee = Total Revenue / Number of Employees
- Conversion Rate = (Conversions / Visitors) × 100
These formulas allow you to see the bigger picture by combining multiple raw data points into meaningful insights.
Why Are Most KPIs Calculated?
Most business performance indicators can’t be measured with a single data point. They require context, which is where formulas come in. For example, knowing that 100 customers left last month doesn’t help unless you know:
- How many new customers joined
- What percentage of your total customer base that represents
- How it compares to previous months
That’s why formulas power the most insightful KPIs.
Why Calculated KPIs Offer More Value
1. They Provide Context
A single number can be misleading. Formulas help turn raw data into actionable insights.
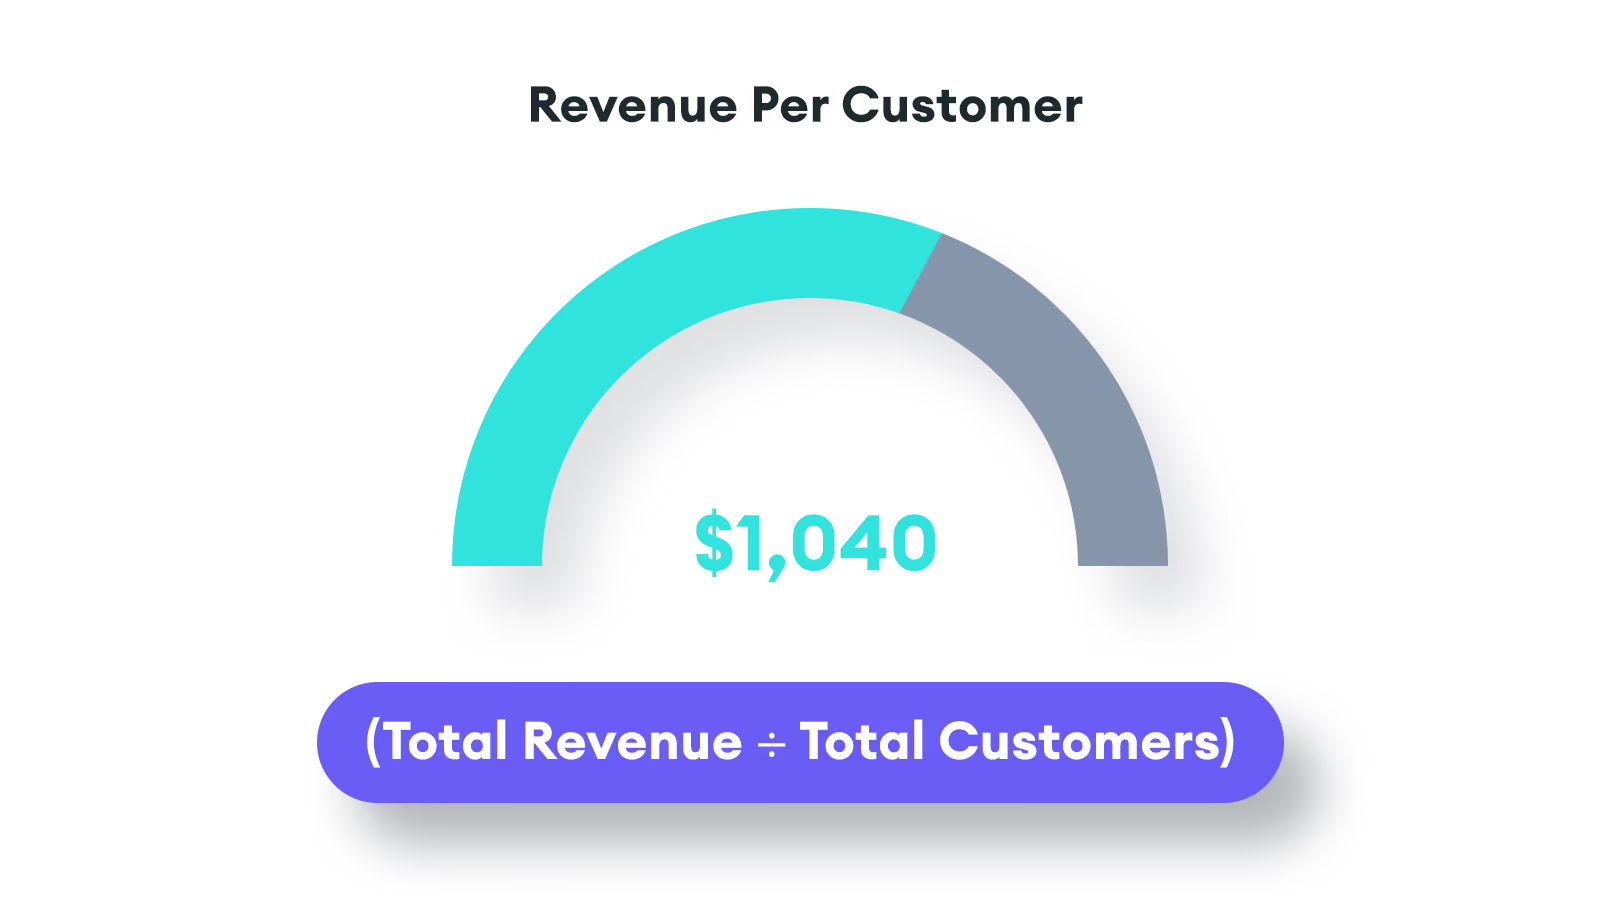
Example: Just tracking total sales doesn’t tell you much, but Revenue Per Customer (Total Revenue ÷ Total Customers) gives real insight into customer value.
2. They Help Compare Performance Over Time
Formulas help standardize metrics, so you can compare month-over-month, year-over-year, or across departments.
Example: A SaaS company tracks Monthly Recurring Revenue (MRR) Growth using: MRR Growth (%) = ((Current MRR - Previous MRR) / Previous MRR) × 100
3. They Make Goal-Setting More Meaningful
Instead of setting vague targets like "increase sales," you can create specific, measurable goals such as "Improve Gross Profit Margin from 35% to 40% within 6 months."
How to Create Calculated KPIs in SimpleKPI
Creating a formula-based KPI in SimpleKPI takes just a few steps. Here’s how:
Step 1: Choose Your Base Metrics
Before you create a calculated KPI, define the core metrics you'll need. For example, if you want to track Customer Acquisition Cost (CAC), you need:
- Total Marketing Spend
- Number of New Customers
Step 2: Apply a Formula
Inside SimpleKPI, navigate to "Calculated KPIs" and enter your formula. For Customer Acquisition Cost (CAC):
CAC = Total Marketing Spend / New Customers
Step 3: Automate Your KPI Updates
SimpleKPI automatically updates calculated KPIs as new data flows in. No need for manual calculations. Just set it up once, and let the system do the rest.
Step 4: Visualize & Share
Once created, your calculated KPI can be:
- Displayed on KPI Dashboards
- Tracked over time
- Included in automated KPI Reports
More on creating a managing Calculated KPIs can be found on our help center
Calculated KPIs provide a powerful way to gain deeper insights into business performance, ensuring that decisions are driven by meaningful data rather than isolated figures. By using formulas, businesses can track progress more accurately, compare trends over time, and set more strategic goals. Formula-based KPIs bring a level of clarity that raw numbers alone cannot provide, whether you're measuring customer retention, employee efficiency, or revenue growth.
Track KPIs like these on SimpleKPI's KPI dashboards, with one flat price for unlimited users and a 14-day free trial.