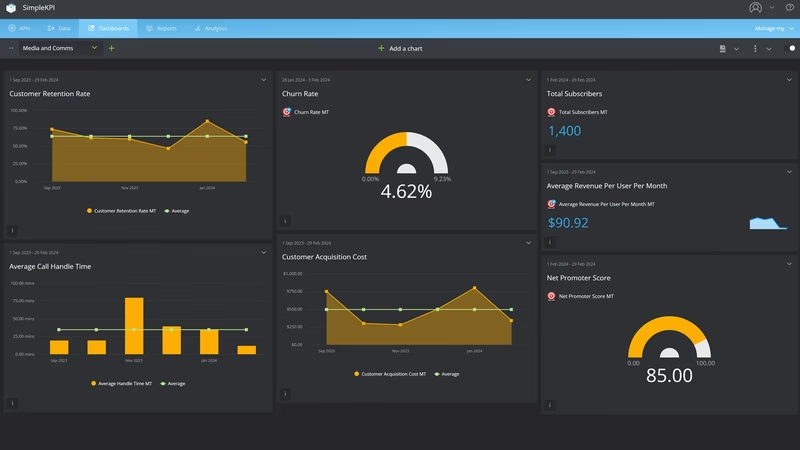
PR and Communications Performance Dashboard
On the Monday after a quarter closes, the communications report goes to the leadership team. The first slide says 1.9 billion in potential reach. The second says the coverage was worth $4.1 million in advertising. A board member asks which part of the $4.1 million they can spend, and the room goes quiet.
That question is harder to dodge than it used to be. AMEC, the international association for communication measurement, set out the Barcelona Principles in 2010 with PRSA among its partners, and has campaigned against advertising value equivalency ever since. The Barcelona Principles 4.0, published in June 2025, put it plainly in Principle 5: invalid measures such as AVEs should not be used, and communication should be judged by its outcome and impact. The same guidance names impressions and likes as vanity metrics to get past.
Earning coverage worth measuring is harder too. The Bureau of Labor Statistics counts 314,500 public relations specialists in 2025 against 47,100 news analysts, reporters and journalists, about 6.7 to 1, and expects the reporters' number to fall 6% by 2035. In Muck Rack's State of Journalism 2026 survey, 86% of journalists said at least some of their stories start with a PR pitch, and 88% said they immediately disregard pitches that miss their beat.
This organization is fictional: a nonprofit health system with four hospitals in a Southeastern US metro and an in-house communications team of eleven. Its monthly figures are modeled, as are the reach and AVE totals its old report used.
What is a Media and Comms KPI Dashboard?
Overview
A media and comms KPI dashboard, often called a PR analytics dashboard, shows whether coverage landed in the outlets your audiences read, carried the messages you meant it to, and changed what people do and think about the organization.
It starts with placement. Earned media mentions in target outlets counts the stories that ran where they matter, not every syndicated copy. Earned share of voice sets that against the competitors in the same outlets.
Then content. Message pull-through shows how much of that coverage carried a priority message, and positive sentiment share shows the tone it was carried in. Both are coded by a person who read the story.
Then response. Coverage referral sessions count the people who clicked from a story to the website. Owned social engagement rate and newsletter click rate show the same thing on channels the team runs itself.
Two numbers measure the team's own service. Media inquiry response time is how long a reporter waits for a real answer. Employee comms reach is how many staff saw anything from internal communications that month. Community favorability, from a survey, sits over the top: the outcome the rest is meant to move.
Who benefits from this dashboard?
- Chief Communications Officer: Takes favorability, pull-through and share of voice to the executive team, and answers the AVE question with a number that doesn't need defending.
- Media Relations Manager: Response time and target-outlet mentions are the week-to-week scoreboard. Pull-through shows which pitches carried the message and which just got the name in.
- Digital and Content Lead: Do coverage and owned content send anyone anywhere? Referral sessions, social engagement and newsletter clicks answer that.
- Internal Communications Manager: Employee reach, split by site and shift, shows which wards and night teams the intranet and app never reach.
- CEO and Board: One page that links communications work to how the community sees the organization, in place of a figure nobody can spend.
When you change how a KPI is counted, keep the old months and put a note on the break. Restate history quietly and the step down looks like a collapse, and the next person to read the chart will try to fix the wrong thing.
Dashboard Example Overview
The health system has about 9,400 employees across four hospitals and a network of clinics, and competes with two other systems for patients, staff and headlines. Its communications team reports monthly against ten KPIs:
- Earned Media Mentions in Target Outlets: Earned items naming the organization in an agreed list of 64 outlets: the metro daily, four local TV stations, two business journals, state health policy press and the trade titles hospital executives read.
- Earned Share of Voice: The organization's mentions divided by its own plus the two competitors' mentions, in the same outlets. It tells you whether you're in the conversation about local healthcare, not whether that's good.
- Message Pull-Through Rate: Target-outlet items carrying at least one of three priority messages, divided by target-outlet items. Coded by a person, against a written test for each message.
- Positive Sentiment Share: Target-outlet items coded positive toward the organization, divided by items coded. Neutral stays neutral: a story about a new MRI suite isn't automatically praise.
- Coverage Referral Sessions: Website sessions whose referrer is a coverage URL. It shows a story sent people somewhere, usually to a find-a-doctor or service page.
- Owned Social Engagement Rate: Engagements on the organization's social posts divided by impressions on those posts.
- Newsletter Click Rate: Unique clicks on the community health newsletter divided by newsletters delivered. Clicks, not opens, for reasons covered below the table.
- Media Inquiry Response Time: Median hours from a reporter's inquiry being logged to the first substantive answer. "We're looking into it" doesn't stop the clock.
- Employee Comms Reach: Employees who opened at least one internal communication in the month, on the intranet, app or email, divided by active employees.
- Community Favorability Rating: The share of service-area adults rating the organization favorable, from marketing's monthly tracker of about 1,000 people. The outcome measure.
For the first six months, the report runs the old way. From October 2024 to March 2025 the board counts 402 to 459 mentions a month, share of voice sits near 43% and sentiment runs 68 to 70% positive. The quarterly pack adds the headline totals: 1.9 billion potential reach and $4.1 million in AVE for the first quarter of 2025.
After the board member's spending question in March 2025, the team rebuilds the report around AMEC's framework from April. Mentions count only the 64 target outlets. Sentiment is coded by people instead of the monitoring tool. AVE and reach come off the report. To get a fair baseline, the monitoring vendor back-codes six months of target-outlet clips for message pull-through.
April 2025 looks like a disaster on paper. Mentions fall from 431 to 97. Share of voice drops from 43.0% to 26.0%. Positive sentiment falls from 68.9% to 39.2%. Nothing had actually got worse. The old count was full of wire pickups and scraped reposts, and the tool marked most hospital stories positive. The back-coding shows pull-through had been between 27.3% and 30.1% all along.
So the team changes how it works. Fewer press releases, more pitches to named reporters on the target list, each built around one of three messages: shorter emergency room waits, the new cancer center and the nurse residency program. Every pitch offers a link to a specific page. The "share to win" posts that inflated social engagement stop.
The summer goes badly. A media relations manager leaves and the new coding work eats into the team's week, so response time climbs from 3.0 hours in April to 4.4 in July. Social engagement rate falls from 2.33% in March to 1.81% in June once the giveaways go. In September 2025 the team sets up an on-call rotation for inquiries, and response time drops to 2.6 hours that month and 2.0 by November.
By December 2025 the real gains are showing. Pull-through reaches 41.5% and positive sentiment 47.5%. Coverage referral sessions hit 4,730, against 3,120 in December 2024, because target-outlet stories now link to something.
Then January 2026 brings a nurses' contract negotiation into the news. Mentions jump to 141, then 152 in February, and share of voice reaches 35.9% and 36.7%, the only months since the April reset that it beats its 35% target. Positive sentiment drops to 34.2% in February, pull-through falls to 35.5% and favorability dips to 55%. The share of voice the team wanted came from the story it least wanted. Response time holds at 2.6 hours in January despite the surge, which the on-call rotation made possible.
By September 2026 the board reads differently. Mentions in target outlets are 128, against 106 a year earlier. Share of voice is 33.8%, pull-through 48.4% and positive sentiment 52.3%. Referral sessions are 6,470, up from 4,260. Newsletter click rate is 3.11%, from 2.48%, and the median reporter waits 1.6 hours. Favorability has moved from 58% to 62%, still short of its 65% target.
Social engagement and employee reach are the clearest misses. Engagement recovers to 2.91% but doesn't reach 3%. Employee comms reach climbs from 58.3% to 74.1%, short of 80%, because night-shift and per diem staff rarely open the app. And on the old report's terms, September 2026, with 128 mentions, looks a lot smaller than October 2024 with 418. On the measures that say what the coverage did, it's the better month.
Creating a Media and Comms Dashboard in SimpleKPI
-
Step 1 Fix the outlet list and the competitor set before counting
Which outlets make the target list, and why? Which competitors go in the share of voice denominator? Write both down and review them once a year, not when a month looks bad. Adding a trade title in June can lift mentions by more than any campaign did.
For help deciding which measures make the cut, the KPI selection guide goes deeper.
-
Step 2 Write a coding guide for messages and sentiment
Give each priority message a one-line test, and give coders examples of positive, neutral and negative for your sector. A quote from your CEO in a story about a competitor's layoffs is a mention, but it might not be a positive one. Have two people code the same sample each month and compare.
-
Step 3 Name an owner for each source
The monitoring vendor or coder owns mentions, share of voice, pull-through and sentiment. Web analytics owns referral sessions, so coverage URLs need logging as they run. The press office inquiry log owns response time, which means every call and email gets a timestamp. Internal comms owns reach, and marketing owns the favorability tracker.
-
Step 4 Read outputs, out-takes and outcomes in that order
At the monthly review, start with what ran and what it said, then what people did, then favorability. A rise in mentions with flat referral sessions and flat favorability means the coverage isn't reaching anyone who acts on it.
List of Media and Comms KPIs
Only newsletter click rate has a published benchmark here, from Mailchimp. AMEC publishes frameworks rather than targets, so the rest are starting points to replace with your own history once you have a year of consistently coded data.
| KPI Name | Typical Target | Description / Calculation |
|---|---|---|
| Earned Media Mentions in Target Outlets | ≥ 120 a month (starting point) | Earned items naming the organization in the agreed target-outlet list. |
| Earned Share of Voice | ≥ 35% (starting point) | Organization mentions divided by organization plus named competitor mentions, same outlets and period. |
| Message Pull-Through Rate | ≥ 45% (starting point) | Target-outlet items carrying at least one priority message divided by target-outlet items. Human-coded. |
| Positive Sentiment Share | ≥ 50% (starting point) | Target-outlet items coded positive divided by items coded. |
| Coverage Referral Sessions | ≥ 6,000 a month (starting point) | Website sessions with an earned coverage URL as the referrer. |
| Owned Social Engagement Rate | ≥ 3% (starting point) | Engagements on owned social posts divided by impressions on those posts. |
| Newsletter Click Rate | ≥ 3% (Mailchimp all-industry average 2.62%) | Unique clicks divided by newsletters delivered. |
| Media Inquiry Response Time | ≤ 2 hours (starting point) | Median hours from inquiry logged to first substantive response. Lower is better. |
| Employee Comms Reach | ≥ 80% (starting point) | Employees opening at least one internal communication in the month divided by active employees. |
| Community Favorability Rating | ≥ 65% (starting point) | Surveyed service-area adults rating the organization favorable (top two boxes) divided by respondents. |
Mailchimp's benchmark dates from December 2023, and the same page warns that Apple's Mail Privacy Protection affects open rates. That's why its 35.63% average open rate isn't on this board. For the paid side of the mix, see the marketing dashboard example.
Why Media and Comms Dashboards Matter
A communications team can make almost any month look good on one number. Send more releases and mentions go up. Get caught in a bad story and share of voice goes up. Run a giveaway and engagement goes up. Each of those can happen while favorability, the thing the work is for, goes nowhere.
So the ten belong on one screen. Share of voice and positive sentiment pull apart whenever the news turns, as they did for this health system in February 2026. Mentions and pull-through pull apart when the team chases volume, because a quick quote in a roundup counts as a mention and rarely carries a message. Response time competes with everything else for the same eleven people, and it's the first thing to slip when a coding project or a vacancy lands.
AMEC's own guidance warns against leaning only on automated dashboards and number-led reports, and it's right. The numbers here only work because a person codes the coverage and someone owns each source. What a dashboard adds is seeing all ten at once, every month, against targets agreed in advance, so the quarterly board pack can't quietly lead with whichever figure went up. There's more on that trap in five examples of KPI bad practice.
For a health system the test is concrete. When a nurse contract dispute hits the evening news, does the team answer reporters inside two hours, do the priority messages still make it into the story, and does favorability come back within a quarter? This board answers all three, and not all in the team's favor: 2.6 hours, a pull-through dip to 35.5%, and favorability back from 55% to 59% by April.
Building it in SimpleKPI
Build this dashboard yourself with SimpleKPI's KPI dashboards, or start from the Marketing KPIs template. The mechanics are the same whatever you track:
- KPIs: each one gets a target, an entry frequency and tags, so you can report by team, site, product or whatever you split the numbers by.
- Data: type numbers in, import a spreadsheet, or use an integration or the API. The dashboard updates as each number lands, so daily and monthly KPIs sit side by side.
- Reports: scheduled KPI reports email the numbers to people who never log in.
- AI: Kip, the built-in AI, suggests targets and flags indicative benchmarks (AI estimates, not peer data) once some history builds up.
- Price: $79 a month for unlimited users and KPIs, as one flat price, with a 14-day free trial and no card needed.