What is a Retail Holiday Season Dashboard?
A retail holiday season dashboard is a visual display that brings a retailer's peak trading KPIs, such as total sales, conversion rate, stockouts and checkout times, together on one screen. It shows performance against seasonal targets in real time, so problems surface while there is still season left to fix them. Timing is the whole point. A slow report in March is an inconvenience; a slow report in December is lost revenue.
Overview
Holiday trading compresses months of normal activity into a few weeks, and the numbers that describe it live in different places: sales in the POS, stock in the inventory system, satisfaction scores in a survey tool. A dashboard puts them side by side, which is where they start explaining each other. When conversion dips on a busy Saturday, the checkout time figure usually tells you why.
Most holiday dashboards keep three things in tension:
- Sales pace tracks whether daily revenue is keeping up with the seasonal plan, and whether the average basket is growing or shrinking under discounting.
- Stock position: what is selling through, what is about to run out, and what will need marking down in January.
- Customer experience: queues, service and the satisfaction scores that decide whether December shoppers come back in February.
The example on this page covers all three, plus the staffing numbers that hold them together.
Who benefits from this dashboard?
- Store managers: same-day reads on sales, stock and queues, so staffing and layout decisions happen while they can still change the week.
- Retail owners: a full view of store performance during the highest-stakes weeks of the year, without asking anyone to compile it.
- Merchandisers and buyers: sell-through and stockout figures show which lines need a reorder and which need a markdown, while suppliers can still respond.
- Regional and operations managers: the same ten KPIs across every store make weak performers obvious and good practice portable.
Dashboard Example Overview
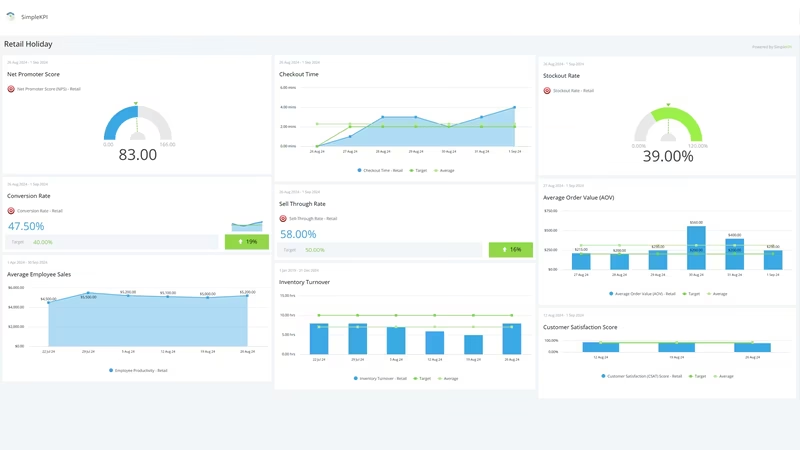
The dashboard pictured here is a retail holiday board built in SimpleKPI. It tracks ten KPIs, grouped around four questions:
- How much are we selling? Total Sales tracks revenue against the seasonal target, while Average Order Value (AOV) and Conversion Rate show whether the money comes from more buyers or bigger baskets.
- Is the stock holding? Inventory Turnover, Sell-Through Rate and Stockout Rate describe the stock position together: how fast it moves, how much of the seasonal buy has sold, and what has already run out.
- Are customers leaving happy? Customer Satisfaction (CSAT) Score and Net Promoter Score (NPS) measure the experience while there is still time to fix it, not in a January review.
- Can the floor keep up? Employee Productivity and Checkout Time show whether staffing matches footfall, and whether queues are quietly costing sales.
Ten numbers is deliberate restraint. Every one can be pulled from systems a retailer already runs, and each answers a question a manager will actually ask in December.
Read Sell-Through Rate next to Stockout Rate. High sell-through with rising stockouts means demand beat the buy, and the reorder conversation needs to happen this week, not after the season.
Creating a Retail Holiday Season Dashboard in SimpleKPI
-
Step 1 Decide what the season has to deliver
Set the seasonal sales target, the stock you have committed to, and the service standard you want to hold under pressure. Last year's numbers are the best starting point. This guide to essential Q4 KPIs for a strong year-end helps with the shortlist.
-
Step 2 Add your retail KPIs
Create each KPI in SimpleKPI with a seasonal target and an entry frequency: daily for sales and checkout times, weekly for stock counts. Tags keep multiple stores or departments organized, and plans include unlimited KPIs, so nothing gets cut to fit.
-
Step 3 Connect your data
Feed numbers in through spreadsheet imports, integrations or the API. POS exports cover sales and transactions, stock systems cover turnover and sell-through, and survey tools supply CSAT and NPS.
-
Step 4 Build views for different audiences
A sales-and-queues view on the back-office screen for the floor team, a stock view for merchandising, a one-page summary for the owner. Same data, different framing. KPI analytics sit underneath every view for the moment someone needs to know why a number moved, not just that it did.
-
Step 5 Review daily, adjust weekly
In peak weeks a five-minute morning check replaces the month-end review cycle. Let scheduled KPI reports carry the day's numbers to owners and head office automatically. Kip, the built-in AI, can suggest seasonal targets and flag indicative benchmarks (AI estimates, not peer data) as your history builds. When the season ends, keep the dashboard. It is next year's plan.
List of Retail Holiday Season KPIs
The table below covers every KPI on the example dashboard. Targets are general guidance; last season's numbers are a better benchmark than any generic range.
| KPI Name | Typical Target | Description |
|---|---|---|
| Total Sales | On seasonal target or above | Overall revenue for the holiday period, tracked daily against the plan. The headline figure the rest of the board exists to explain. |
| Average Order Value (AOV) | At or above last season | Average revenue per transaction. Rising AOV means bundles and upsells are working; a falling figure usually points at discounting. |
| Conversion Rate | Set from your baseline | The percentage of visitors who buy. Big holiday footfall with flat conversion suggests browsers, queues or stock gaps. |
| Inventory Turnover | Faster than off-season | How quickly stock is sold and replaced. Holiday turnover should run well ahead of the rest of the year. |
| Sell-Through Rate | 70-80% by season end | The share of seasonal stock sold versus what was bought in. The clearest verdict on the buying plan. |
| Stockout Rate | Under 5% | The percentage of products out of stock. Every stockout on a gift line in December is a sale handed to a competitor. |
| Customer Satisfaction (CSAT) Score | 80%+ | How satisfied shoppers are with the experience. Worth watching daily when stores are busiest and staff are most stretched. |
| Net Promoter Score (NPS) | Positive and trending up | How likely customers are to recommend the store. Holiday shoppers who become promoters are next year's repeat customers. |
| Employee Productivity | Set from your baseline | Revenue generated per employee. Keeps seasonal staffing honest: enough people to serve, not so many the margin disappears. |
| Checkout Time | Under 5 minutes, queue included | Average time to complete a purchase. The number most directly tied to abandoned baskets on peak days. |
Why Retail Holiday Season Dashboards Matter
For many retailers the holiday weeks decide the whole year, and every decision made in them moves the result. The trouble is timing. Monthly reports arrive after the season they describe, when nothing can be done about any of it. A dashboard shortens the feedback loop from weeks to hours, which is the difference between reordering a best-seller and watching its shelf sit empty.
The stock KPIs do the most preventive work. Sell-Through Rate and Stockout Rate lead; by the time Total Sales disappoints, the cause is usually a stock decision the dashboard would have flagged weeks earlier. Checkout Time plays the same role for the customer experience, warning about the queues that CSAT will confirm later.
There is a quieter benefit too. Holiday teams are full of temporary staff who have never seen the targets before. A dashboard on the back-office screen tells them what matters without a briefing, and gives the store manager one honest picture to run the day from. When January arrives, the same board becomes the season review, already written.
Build this dashboard yourself with SimpleKPI's KPI dashboards, and pay one flat price for unlimited users and KPIs.