Average Wait Time how long callers wait before they're helped
Track the time callers spend waiting in a queue, on hold, or for a more detailed task to be completed, and use it to keep waiting times under control.
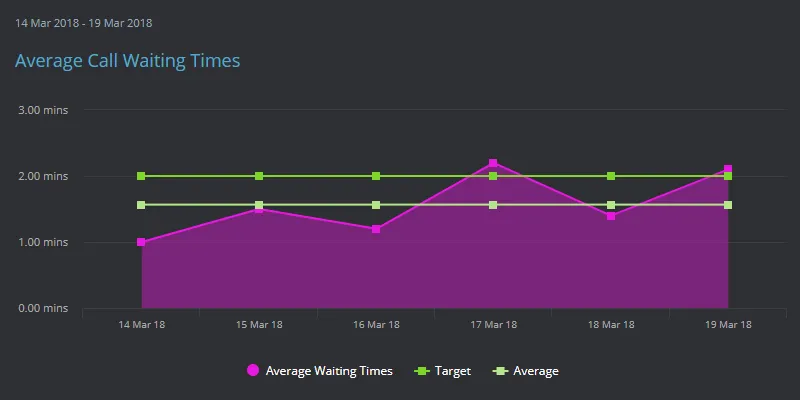
What is average waiting time?
Average waiting time is the average of all the time a caller spends without being engaged by a representative, agent, or customer service team member. This can be time spent in a call queue, on hold for another team member, or waiting while a representative completes a more detailed task.
No one enjoys being held in a queue. Beyond the immediate frustration, the longer someone waits, the more likely they are to share that negative experience with others, whether by word of mouth or on social media.
Average waiting time across all interactions is a good way to measure overall call handling efficiency. It can highlight issues with call routing and internal communication systems, as well as how well agents handle inquiries.
It's also a useful indicator for staffing levels, helping you spot when a call center needs more agents.
Once you've measured average waiting time, you can start reducing it. This usually means analyzing the data to break waiting times down by cause.
Reducing average waiting time
There are a few practical steps you can take to bring waiting times down:
- Increase the number of customer service agents during high-volume periods.
- Identify your most frequent call topics and look at whether that information could be provided directly through your automated call management system.
- Group callers by how complex their query is, and route higher-complexity callers to your most experienced agents before they're even connected.
- Add more agents at the times of day that are historically busiest.
How to calculate Average Wait Time
Average wait time is the total time callers spend waiting divided by the number of calls in the period: Average Wait Time = Total Waiting Time / Number of Calls. Work in seconds and convert at the end.
Total waiting time is every second a caller is not being engaged: queue time before pickup, hold time once connected, and any wait while an agent finishes a task. Number of calls is the denominator, and you have to decide what goes in it. Answered calls only is the common choice. Including abandoned calls, counted to the second the caller hung up, is the honest one. Pick one and don't switch mid-quarter.
A worked example
Say a support line answers 800 calls in a week. The phone system reports 24,000 seconds of queue time and 12,000 seconds of hold time, so total waiting time is 36,000 seconds. Divide by 800 and the average wait time is 45 seconds.
Now split that same week. Around 700 of those calls waited about 20 seconds each, which accounts for 14,000 seconds. The remaining 22,000 seconds belong to 100 calls, so those callers waited 220 seconds apiece, just under four minutes. The headline 45 seconds is arithmetically correct and describes almost nobody's actual experience. That gap is why this KPI needs company.
How to improve Average Wait Time
- Offer a callback instead of a hold. A caller who takes the callback stops queuing and stops thinking about hanging up. Decide up front whether the virtual wait still counts in your total, then write that into the definition so the number stays comparable.
- Separate queue time from hold time. Queue time is a staffing and routing problem. Hold time usually means the agent is hunting for information, and fixing that adds capacity without hiring.
- Match the roster to the demand curve. Plot wait time by half-hour interval across a normal week. Some teams already have the people and have them pointed at the wrong hours. If the peaks still go uncovered once the roster fits demand, that is your case for more agents.
- Cut transfers. Every transfer restarts the wait, and the second wait is the one people remember.
- Trim after-call work. Agents in wrap-up are not answering calls. Twenty seconds off wrap-up across a shift frees real capacity.
What Average Wait Time does not tell you
- The average hides the tail. A few very long waits sit quietly inside a respectable mean, and those callers are the ones who complain. Read it next to Service Level, the share of calls answered inside a threshold. Answering 80 percent of calls within 20 seconds is a common convention in call centers, not a benchmark anyone measured for you.
- Counting only answered calls flatters the number. Callers who gave up waited too, so wait time falls as abandonment rises. Keep Abandoned Calls in view or you will celebrate the wrong trend.
- Fast answers are not good answers. Squeeze wait time hard enough and agents pick up before they are ready, which comes back as repeat calls. First Call Resolution is the check on that.
- A short wait is not a happy caller. Wait time measures the queue, not the outcome. Customer Satisfaction says whether the speed bought you anything.
Frequently asked questions
What is a good average wait time for a call center?
There is no universal number, and anyone quoting one is guessing at your queue. The usual reference point is the 80/20 service level convention, answering 80 percent of calls within 20 seconds. Treat it as a convention rather than a law. Set a target from your own baseline and tighten it as the queue improves.
What is the difference between average wait time and average speed of answer?
Average speed of answer counts only queue time before an agent picks up. Average wait time is broader, adding hold time during the call and any wait while an agent finishes a task. Treat a reported ASA figure as one component, not the whole thing.
Should abandoned calls be included in average wait time?
Both conventions are in use. Excluding them is more common, but it makes the number improve as service gets worse, because the longest waiters drop out of the sum. Track both versions if your phone system gives you the data.
How do you track average wait time in SimpleKPI?
Export the figures from your ACD or telephony platform and load them by spreadsheet import, integration or the API, then set a target and a reporting frequency. Plans are a flat $79 a month, or $67 a month billed annually at $804 a year, with unlimited users, dashboards, reports and KPIs, so you can track wait time by queue, team and interval without counting seats. The 14-day trial needs no credit card.
Track Average Wait Time alongside the rest of your call center metrics on SimpleKPI's KPI dashboards, or start from the call center KPI template: one flat price for unlimited users and KPIs.