Total Answered Calls KPI
Measuring agent performance through the number of calls answered.
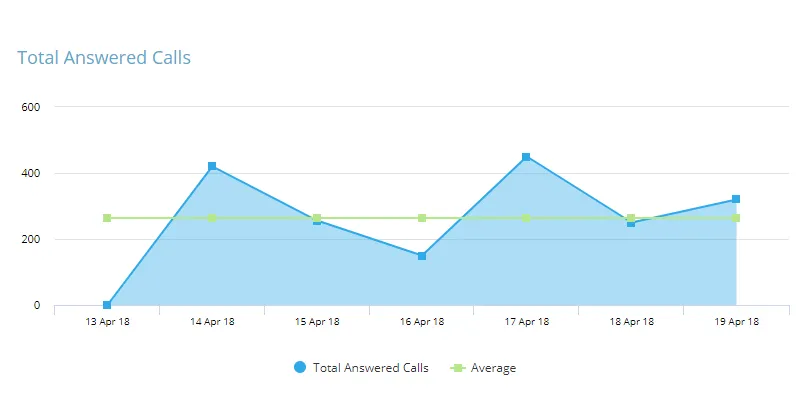
What are Total Answered Calls?
Answered calls, also referred to as total engaged calls, is a direct measurement of all inbound calls answered by an agent during business hours. This metric is closely related to Total Calls, and is often visualized alongside other call metrics, such as missed calls and abandoned calls.
It's also used in calculated KPIs, such as the percentage of answered calls, with the aim of improving call center efficiency.
A call is deemed answered when there's a talking event between an agent and caller. This measurement can be skewed when calls answered by an automated system are included in the figures.
Total Answered Calls by agent can also be used as a top-level indicator, or a starting point for further investigation. For example, it may be tracked by agent and broken down into related metrics such as Average Call Length, giving an indication of how efficient an agent is at handling a caller's request.
How to calculate Total Answered Calls
Total Answered Calls is a count, not a ratio. It's every inbound call that reached a live agent in the period, and it's usually derived by subtraction: Total Answered Calls = Total Inbound Calls - Abandoned Calls - Unanswered Calls. The percentage usually reported next to it is Answered Call Rate = (Total Answered Calls / Total Inbound Calls) x 100.
Total Inbound Calls is every call offered to the queue. Abandoned Calls are the ones where the caller hangs up before connecting. Unanswered Calls ring out, overflow or reach voicemail with no talk event. A call counts as answered once there's a talk event between an agent and a caller, which keeps IVR and auto attendant pickups outside the number.
A worked example
Say a support line is offered 4,000 calls during business hours in a month. 320 callers hang up while waiting, and 180 ring out with nobody free to pick up. Total Answered Calls is 4,000 - 320 - 180 = 3,500, an answered rate of 87.5%. Across ten agents working twenty days each, that's 350 calls per agent, or 17.5 a day.
The average is the least interesting part. One agent answers 480, another 210. Before promoting the first, check handle time and resolution: 480 short calls that generate callbacks cost the queue more than 210 that end the issue. The figures here are illustrative.
How to improve Total Answered Calls
- Staff to the arrival curve, not the daily average. Calls go unanswered in the specific half hours where demand outruns cover. Chart volume by interval, then move breaks and training into the quiet ones.
- Cut the reasons people ring back. Every repeat call is a first-time caller left waiting. Fix what makes people call twice and you free capacity you already pay for.
- Offer a callback instead of a queue. A caller who takes one doesn't abandon, and the call still gets answered later when the floor is quieter.
- Wrap time is agent time. Shorter notes and fewer mandatory fields return people to available sooner.
- Put a live answered-versus-offered count on a wall screen. Agents manage their own break timing once they can see the queue.
What Total Answered Calls does not tell you
- It counts effort, not outcomes. An agent who hurries callers off the line answers more of them. Read it beside Call Handle Time and First Contact Resolution or you'll reward the wrong behavior.
- The number tracks demand more than performance. A quiet week produces a low count and says nothing about the team. Convert it to a percentage of calls offered, and show Abandoned Calls beside it.
- Answered eventually is not answered promptly. A call picked up after six minutes counts the same as one picked up in ten seconds. Service Level catches that difference; the common convention is 80% of calls answered within 20 seconds.
- The count is only as clean as its source. Automated pickups, transfers counted twice and test calls all inflate it. Agree the definition with whoever owns the phone system first.
Frequently asked questions
What is the difference between total calls and total answered calls?
Total Calls, or Total Inbound Calls, is everything offered to the queue. Total Answered Calls is the subset that reached a live agent. The difference is abandoned and unanswered calls, and that gap is usually where the problem sits.
What is a good answered call rate?
There's no universal figure. Set a target from your own baseline and improve on it. The 80/20 service level convention, answering 80% of calls within 20 seconds, is a practitioner rule of thumb rather than a benchmark anyone measured for you.
Do IVR and voicemail pickups count as answered calls?
No. A call is answered when there's a talk event between an agent and a caller. Counting automated pickups inflates the number and hides queue problems, so exclude them at the source rather than adjusting later.
How should I compare answered calls between agents?
Normalize first. Divide by hours logged or days worked, because shift patterns and part-time hours make raw counts meaningless. In SimpleKPI the raw count and the per-agent rate can sit as separate KPIs on one dashboard.
Track Total Answered Calls alongside the rest of your call center metrics on SimpleKPI's KPI dashboards, or start from the call center KPI template: one flat price for unlimited users and KPIs.