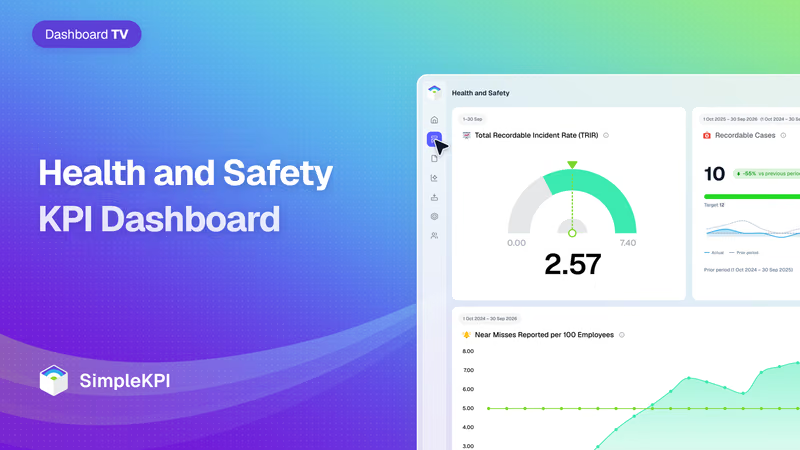
Health and Safety Performance Dashboard
In a lot of plants, the safety report is a single number on a sign by the gate: days since the last lost-time injury.
It looks fine right up until the morning it goes back to zero, and by then the damage is done.
Food plants are tougher on people than most workplaces. According to the BLS, commercial bakeries had 3.7 recordable injuries and illnesses per 100 full-time workers in 2024, against 3.3 for food manufacturing as a whole and 2.3 across private industry.
Those injuries are expensive too.
The National Safety Council puts the cost of work injuries to the US at $181.4 billion in 2024. It puts each injury that needed medical attention at $48,000, once you count lost wages, medical bills and admin.
The catch is that every one of those numbers turns up after someone has been hurt. That's why OSHA's guide to leading indicators asks for "proactive, preventive, and predictive measures". These are numbers that tell you whether the work that prevents injuries is actually getting done, while there's still time to act on them.
This example dashboard follows a made-up commercial bakery in the US Midwest that bakes bread and buns for grocery chains. Around 380 people work there across three shifts, rising to about 430 when seasonal and agency staff come in for the holiday peak. It isn't a real customer, and the monthly figures are modeled. The TRIR and DART targets use the BLS rates for commercial bakeries. The others are marked as starting points, because nobody publishes benchmarks for them.
What is a Health and Safety KPI Dashboard?
Overview
A health and safety KPI dashboard shows how many people were hurt at work, how badly, and whether the work that stops the next injury is being done.
The first half is lagging indicators. Recordable cases, TRIR, DART rate and lost workdays count harm after it has happened. They're the numbers OSHA, insurers and customers ask for.
Then come the leading indicators: near misses reported, safety observations completed, corrective actions closed on time and training completion. These move weeks or months before the injury rate does.
Hours worked sits underneath both rates. First aid cases sit beside them, as a check on whether people are reporting the small things.
Who benefits from this dashboard?
- Plant Manager: TRIR and DART rate against the industry rate, once a month, and the leading indicators that say where those rates are heading next.
- EHS Manager: Near misses and corrective actions show where the next injury is most likely, and whether the fixes agreed last month were made.
- Shift Supervisors: Safety observations and training completion are theirs to move. A supervisor who misses the walks shows up here before anything goes wrong on the line.
- HR and Operations Director: Lost workdays and recordable cases feed workers' compensation costs, staffing cover and what the plant reports to customers who audit it.
Set near misses reported to "higher is better" when you create it, and give first aid cases no direction at all. Both go up when people start reporting honestly, and a dashboard that turns them red teaches the plant to stop reporting.
Dashboard Example Overview
The example bakery reports monthly. The two rates are rolling 12-month figures, recalculated each month. Ten KPIs:
- Hours Worked: All hours worked in the month, seasonal and agency staff included. It has no target. It's the denominator for both rates, and it shows when the plant is stretched.
- Recordable Cases: Injuries and illnesses that go on the OSHA 300 log in the month. First aid alone doesn't count, which is why first aid cases get a line of their own.
- Total Recordable Incident Rate (TRIR): Recordable cases per 100 full-time workers, over the last 12 months. It uses the BLS incidence rate formula, so it compares directly with the published rate for your industry.
- DART Rate: The same rate, counting only cases with days away from work, restricted work or a job transfer. It tracks how serious the injuries were.
- Lost Workdays: Calendar days away from work in the month, across every open case. OSHA counts calendar days, not shifts, and lets you stop counting a case at 180.
- First Aid Cases: Injuries treated with first aid only, which OSHA doesn't count as recordable. It has no target and no direction.
- Near Misses Reported per 100 Employees: Near misses and hazards reported in the month, per 100 people on the payroll. OSHA defines a near miss as "an incident that could have, but did not, result in death, injury, or illness." Here, more is better.
- Safety Observations Completed: Supervisor safety walks and observations done, as a share of those scheduled.
- Corrective Actions Closed on Time: Fixes due in the month that were closed by their due date. An open action is a hazard someone already found.
- Safety Training Completion: Required safety training completed on time, seasonal and agency staff included.
Over two years, the dashboard tells a story a lot of plant managers will recognize.
In late 2024, the plant runs on the lagging numbers. The holiday peak lifts hours worked to 73,600 in November, with agency staff on the lines. Only 81% of required training is done on time that month.
October to December brings 9 recordable cases. By December, the rolling TRIR is 6.31.
Then January 2025.
A sanitation worker is hurt cleaning a dough mixer that hadn't been locked out. The sign by the gate goes back to zero, and lost workdays reach 47 in February.
The investigation finds two things the dashboard couldn't have shown. Operators had talked about near misses on that mixer for months, and nobody wrote them down. And a guard interlock flagged in the September audit was still waiting to be fitted.
So in March 2025, the plant changes four things.
Anyone can report a near miss on a card or a QR code, with no names needed, and the reports are read out at each shift huddle. Supervisors get a weekly safety walk in their calendar. Every corrective action gets an owner and a due date, reviewed by the plant manager each week. And seasonal staff finish their safety training before their first shift, not during it.
The first thing to move is the wrong way round.
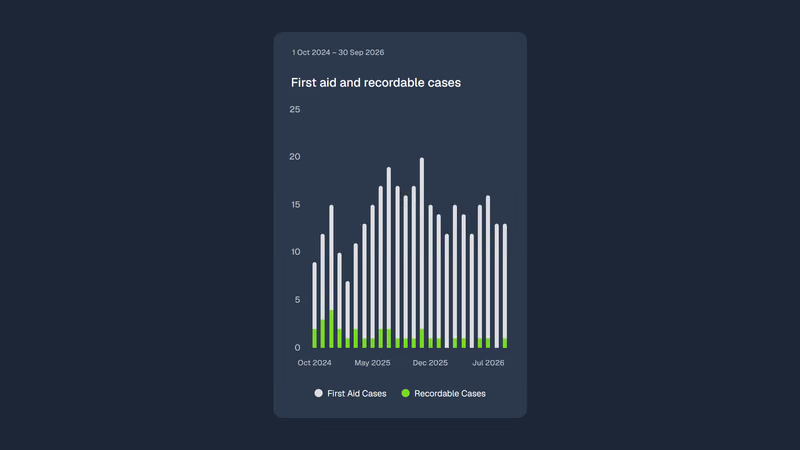
Near misses reported climb from 1.2 per 100 employees in February 2025 to 6.6 in September. First aid cases go from 6 to 17 by July. On the old report, that would have looked like a plant getting less safe.
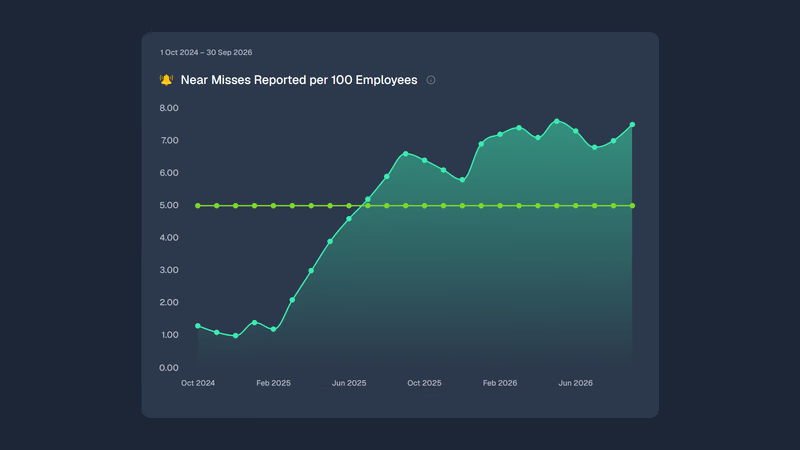
It wasn't. People had started telling someone.
Corrective actions closed on time rise from 49% in December 2024 to 84% by September 2025. Safety observations go from 52% to 89%.
The TRIR barely moves. It's still 6.00 in August 2025. A rolling 12-month rate keeps last winter in it for a full year, so the fixes take a year to show.
The 2025 holiday peak is the real test.
Training completion is 96% before the first seasonal shift. October to December brings 4 recordable cases, down from 9, on slightly more hours.
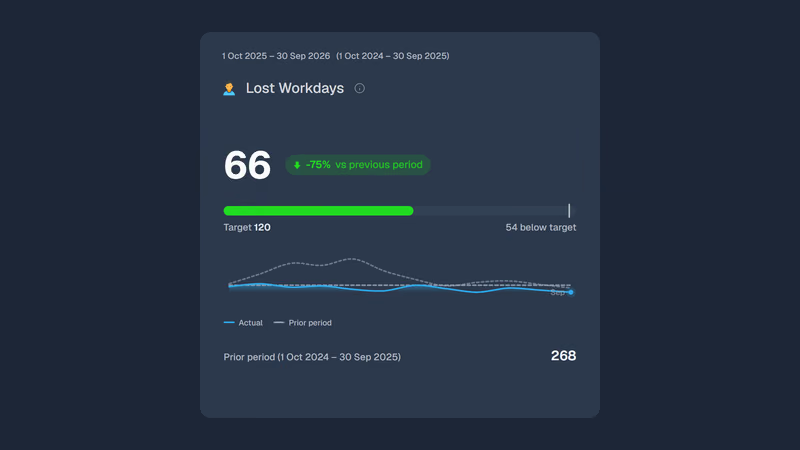
By September 2026, the rolling TRIR is 2.57, against 5.73 a year earlier. The DART rate is 1.28, against 3.64. Lost workdays total 66 for the year, against 268 the year before.
Not everything holds.
Safety observations slip to 79% in July 2026, with supervisors on vacation and nobody covering their walks. Near misses reported dip in the same month. Both recover by September, and the plant now books cover for the walks.
And the TRIR is a small-number figure. At about 780,000 hours a year, each recordable case moves it by about 0.26. One bad month can undo a good quarter on paper, which is why the leading numbers sit on the same screen.
Creating a Health and Safety Dashboard in SimpleKPI
-
Step 1 Agree the definitions first
Use OSHA's recordkeeping rules for recordable cases, DART cases and lost workdays, so your rates compare with the published ones. Then write down what counts as a near miss, a completed observation and a closed corrective action. Those have no official definition, and two sites counting them differently can't be compared.
Need help choosing? Read the in-depth KPI selection guide.
-
Step 2 Add your safety KPIs to SimpleKPI
Set each KPI up with its unit, frequency and direction. Most of the lagging numbers improve as they fall and the leading ones as they rise. Hours worked and first aid cases get no direction at all. Getting those right is what stops the dashboard punishing honest reporting.
-
Step 3 Connect your data
Feed the dashboard from the systems you already run, using imports, integrations or the API. Payroll knows the hours, the incident log knows the cases, and the EHS or maintenance system knows the near misses and corrective actions. Nobody should be rebuilding the 300 log in a spreadsheet every month.
-
Step 4 Build a view per audience
Give shift supervisors a weekly view of observations, near misses and training for their own shift. Give the EHS manager corrective actions by owner and due date. Give the plant manager the monthly rates against the industry rate, with the leading numbers beside them.
-
Step 5 Set targets that reward reporting
Base the TRIR and DART targets on the BLS rate for your industry, then on your own history once you have it. For near misses, set a floor, not a ceiling. And never tie a bonus to a low injury count. It's the quickest way to make injuries disappear from the log rather than from the floor.
List of Health and Safety KPIs
TRIR and DART targets are the 2024 BLS rates for commercial bakeries (NAICS 311812). Use the rate for your own industry. Targets marked starting point have no published benchmark behind them, so set them from your own history.
| KPI Name | Typical Target | Description / Calculation |
|---|---|---|
| Hours Worked | No target | All hours worked in the period, seasonal and agency staff included. |
| Recordable Cases | ≤ 1 a month (starting point) | Injuries and illnesses recorded on the OSHA 300 log in the period. |
| Total Recordable Incident Rate (TRIR) | ≤ 3.7 (BLS, commercial bakeries, 2024) | Recordable cases in the last 12 months × 200,000 ÷ hours worked in the same 12 months. |
| DART Rate | ≤ 2.5 (BLS, commercial bakeries, 2024) | Days away, restricted or transferred cases in the last 12 months × 200,000 ÷ hours worked in the same 12 months. |
| Lost Workdays | ≤ 10 a month (starting point) | Calendar days away from work in the period across all open cases, capped at 180 per case. |
| First Aid Cases | No target | Injuries treated with first aid only. Watch the trend, not the level. |
| Near Misses Reported per 100 Employees | ≥ 5 a month (starting point) | Near misses and hazards reported ÷ average headcount × 100. |
| Safety Observations Completed | ≥ 90% (starting point) | Scheduled safety walks and observations completed ÷ scheduled. |
| Corrective Actions Closed on Time | ≥ 90% (starting point) | Corrective actions closed by their due date ÷ corrective actions due. |
| Safety Training Completion | ≥ 95% (starting point) | Required safety training completed on time ÷ required training due. |
Why Health and Safety Dashboards Matter
Most plants already collect every number on this dashboard. Payroll has the hours, the 300 log has the cases, and somewhere there's a spreadsheet of near misses and a list of overdue actions. They're rarely in one place, and the monthly report usually carries only the first two.
That's the problem with lagging numbers on their own. A plant with a good TRIR and a pile of overdue corrective actions is a plant that's been lucky. You can't tell the difference until the luck runs out.
On one screen, the numbers keep each other honest.
A falling injury rate with falling near-miss reports is worth a second look: are things safer, or have people stopped telling you? Rising first aid cases with a steady recordable count usually means reporting got better. And a TRIR that improves while training completion falls is borrowing against next quarter.
More people are asking for these numbers, too. Since January 2024, establishments with 100 or more employees in industries OSHA designates as high-hazard, bakeries among them, have had to send OSHA case-by-case detail from their injury logs every year. When OSHA, a customer's auditor or an insurer asks how safe the plant is, the log is half the answer. The other half is on this dashboard: what you're doing about the next one.
Building it in SimpleKPI
Build this dashboard yourself with SimpleKPI's KPI dashboards, or start from the Manufacturing KPIs template. The mechanics are the same whatever you track:
- KPIs: each one gets a target, an entry frequency and tags, so you can report by team, site, product or whatever you split the numbers by.
- Data: type numbers in, import a spreadsheet, or use an integration or the API. The dashboard updates as each number lands, so daily and monthly KPIs sit side by side.
- Reports: scheduled KPI reports email the numbers to people who never log in.
- AI: Kip, the built-in AI, suggests targets and flags indicative benchmarks (AI estimates, not peer data) once some history builds up.
- Price: $79 a month for unlimited users and KPIs, as one flat price, with a 14-day free trial and no card needed.