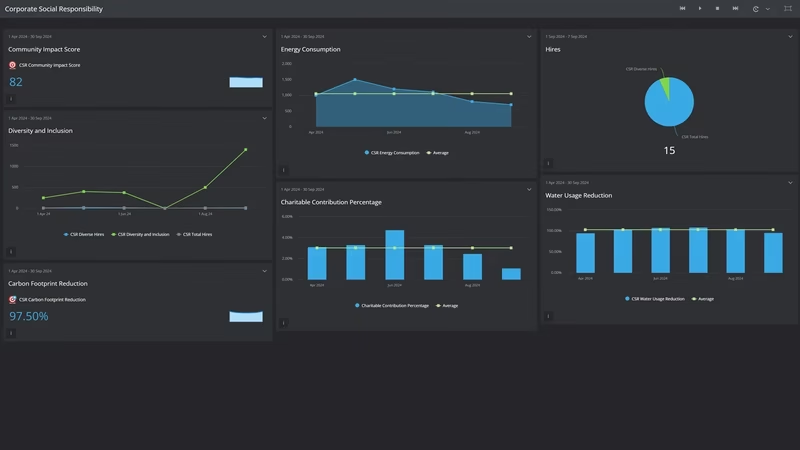
CSR Performance Dashboard
Every spring someone in the CSR team builds the impact report. The volunteer hours get added up, the total goes on a page next to a photo of a food bank shift, and it reads well: over 10,000 hours, about the same as last year. Nobody asks how many people put in those hours. That's the question this example is built around.
Corporate giving is under more pressure than the headline numbers suggest. CECP's Giving in Numbers 2026 Edition found median community investment rose from $21.9 million to $23.5 million in a matched set of companies, yet 52% of companies gave less in 2025 than in 2024 and total giving was flat. The 2025 Edition put the median at 0.78% of pre-tax profit in 2024, short of what CECP calls the 1% field standard.
The governance side is busier too. The NAVEX 2026 whistleblowing benchmark found a record median of 1.65 reports per 100 employees in 2025, and median case closure time up from 21 to 28 days, which NAVEX links to the rising caseload. More people speaking up is good news. Slower answers aren't.
The business in this example is made up: a US maker of commercial kitchen equipment with about 2,400 employees, a head office in Ohio and three plants. The numbers are modeled to show how the board behaves, not drawn from any customer's data. Four of the twelve targets rest on a published benchmark, and the table below says which. The other eight are starting points.
What is a CSR KPI Dashboard?
Overview
A CSR KPI dashboard shows, month by month, whether employees take part in the company's community programs, whether giving keeps pace with profit, whether staff and suppliers are held to the code of conduct, and whether pay and promotion are fair.
It starts with people. Volunteer participation counts how many employees took part at least once in the last year. Volunteer hours per employee shows how much time went in. Matching gift participation shows how many staff gave their own money with the company's match on top.
Then the company's money. Community investment as a % of pre-tax profit puts cash, foundation grants and in-kind donations against what the business earned over the same twelve months, so a good year doesn't flatter the giving.
Then conduct, inside and outside the business. Supplier audit coverage shows how many high-risk suppliers have been checked against the supplier code of conduct in the last two years, and corrective actions closed on time shows whether the problems those audits found got fixed. Code of conduct training, hotline reports per 100 employees and case closure time do the same job for your own staff: do they know the rules, do they use the channel, and how long do they wait for an answer?
Last, the slow numbers: women in management and the adjusted gender pay gap. One emissions line shows the carbon trend, with energy and the detail on our environmental sustainability dashboard example.
Who benefits from this dashboard?
- CSR or Community Relations Manager: Participation, hours and matching gifts are their program's scorecard, and the rolling view shows a slide while there's still time to fix it.
- CFO: Community investment as a % of pre-tax profit answers the budget question in one figure: did giving keep up with the business, or fall behind it?
- Chief Compliance Officer: Training completion, hotline reports and closure time show whether the speak-up program reaches the plant floor as well as the head office.
- Procurement Director: Supplier audit coverage drops the moment new high-risk suppliers are added, so it belongs in the same meeting as the sourcing decision.
- CHRO: Women in management and the adjusted pay gap are the two numbers the board and the annual report will ask about. Monthly tracking means no surprises in March.
Count volunteer participation over a rolling 12 months, not month by month. Most employees volunteer once or twice a year, so a monthly rate just follows the event calendar and hides the trend underneath.
Dashboard Example Overview
The company makes ovens, fryers and refrigerated prep tables for restaurant chains. About 60% of its 2,400 to 2,500 employees work shifts on three plant floors, and it buys from 64 suppliers it rates as high-risk for labor practices, rising to 75 in 2026. It reports monthly against twelve KPIs:
- Employee Volunteer Participation Rate: Employees who logged at least one volunteer hour in the last 12 months, divided by month-end headcount. Paid release time and own-time volunteering both count.
- Volunteer Hours per Employee: Volunteer hours logged in the last 12 months divided by average headcount over the same months.
- Matching Gift Participation Rate: Employees with at least one company-matched donation in the last 12 months, divided by headcount.
- Community Investment % of Pre-Tax Profit: Cash, foundation grants and in-kind giving at fair value over the last 12 months, divided by pre-tax profit for the same 12 months. Employees' own donations are left out, the way CECP counts it.
- Supplier Code of Conduct Audit Coverage: High-risk suppliers with a code of conduct audit in the last 24 months, divided by all high-risk suppliers at month end. It's the operational version of what GRI 414 Supplier Social Assessment asks you to disclose.
- Supplier Corrective Actions Closed On Time: Corrective actions closed by their agreed date, divided by those due in the month. An open finding is a known risk nobody has dealt with.
- Code of Conduct Training Completion: Employees who completed code of conduct and anti-corruption training in the last 12 months, divided by headcount. New starters count from day 30. It's the measure behind GRI 205-2.
- Ethics Hotline Reports per 100 Employees: Reports through every speak-up channel (phone, web, email, in person) over the last 12 months, per 100 employees. Higher is better up to a point, because a quiet hotline is usually an unused one.
- Ethics Case Closure Time: Median calendar days from report received to case closed, for cases closed in the month.
- Women in Management: Women in people-manager roles divided by all people managers. One of the splits GRI 405-1 asks for.
- Adjusted Gender Pay Gap: One minus the ratio of women's to men's average base pay within the same job grade and location, weighted by headcount. GRI 405-2 asks for this ratio by employee category.
- Scope 1 and 2 Emissions Reduction: One minus the last 12 months of Scope 1 and 2 emissions divided by the 2023 baseline.
In October 2024 the program looks healthy. 831 of 2,419 employees have volunteered in the last 12 months, a participation rate of 34.4%. They've put in 10,182 hours, 4.25 per employee, more than double CECP's 2024 median of 1.8. Community investment is about $760,000 against $72.2 million of pre-tax profit, 1.05%.
What nobody has connected yet is a change made that summer. Volunteer sign-up moved from paper sheets in the break rooms to a portal on the intranet. Plant staff, who rarely sit at a company computer, mostly stopped signing up. Because participation is counted over 12 months, the damage leaked in slowly, one month of paper-era volunteers dropping out of the window at a time.
The quarterly reviews saw it and didn't see it. Participation was 33.3% in December, 31.8% in March and 30.4% in June. Each quarter it was down about a point and a half, marked amber, and explained: the holidays, a wet spring. Hours per employee held between 4.24 and 4.26 the whole time, so the summary slide said the program was in good shape.
In August 2025 the CSR manager rebuilt the board with a line chart of participation since October 2024 and a trend line through it. The line ran straight down, about half a point a month, to 29.1%. Hours per volunteer had risen from 12.3 to 14.4. Fewer people were doing more of the work. Split by site, nearly all the fall was on the plant floors.
The fix was dull. In September and October 2025 the company put a kiosk in each plant break room, brought the paper sheets back beside the portal, scheduled events around shift changes, and let supervisors approve four hours of paid volunteer time a year without going through HR. It fits what CECP found: Flexible Scheduling had the highest participation of any volunteer program type, at 43%.
The recovery was as slow as the slide. Participation bottomed at 27.5% in November 2025, 679 people, then climbed to 28.8% in February 2026 and 30.7% in September 2026, 765 people. That's still short of the 35% target, and at this pace it won't get there until well into 2027. Hours per employee reached 4.40.
The kiosks also carried the code of conduct course and the hotline number, in English and Spanish. Training completion reached 97.8% in October and November 2025, and hotline reports rose from 1.27 per 100 employees in September 2025 to 1.49 a year later, still under NAVEX's 1.65. The extra cases had a cost. Median closure time rose to 40 days in April 2026, until compliance added an investigator and brought it back to 29 days by September.
Two numbers went the wrong way for reasons nobody planned. Community investment slipped below 1% for the first time in October 2025 and reached 0.97% in December. Giving hadn't fallen, at $754,000, but pre-tax profit had risen to $78.0 million, and the budget was set in dollars. The 2026 budget was set at 1% of the prior year's profit instead, and the ratio reached 1.10% by September 2026. Then in March and April 2026 purchasing added 11 high-risk suppliers in Mexico and Southeast Asia to cut reliance on a single vendor. Audit coverage fell from 96.9% in February to 85.3% in April, 64 of 75, and on-time corrective actions dropped from 92.9% to 80.0% in March as the audit team's time went to the newcomers. Coverage was back to 94.7%, 71 of 75, by September.
The slow numbers moved the way they usually do. Women in management went from 36.4%, 95 of 261 managers, to 38.7%, 103 of 266. The adjusted pay gap narrowed from 3.2% to 2.4%. Emissions were 15.4% below the 2023 baseline, short of the 20% target.
Creating a CSR Dashboard in SimpleKPI
-
Step 1 Define a volunteer before you count one
Does a volunteer hour on a Saturday count, or only paid release time? Does skills-based work for a nonprofit board count? Are part-time and plant staff in the headcount? Settle it once and write it down, so this year's figure counts the same people as last year's.
If you're still choosing which measures to keep, the KPI selection guide covers how to cut a long list down.
-
Step 2 Settle what counts as community investment
Finance should own this one. Cash and foundation grants are easy. In-kind is where numbers get inflated: value donated equipment at fair value, not list price, and keep employees' own donations out even when the company matches them. Use pre-tax profit for the same 12 months, from the same management accounts every time.
-
Step 3 Give each number an owner outside the CSR team
Procurement owns supplier audit coverage and corrective actions. Compliance owns training, hotline reports and closure time. HR owns women in management and the pay gap, with legal reviewing the pay analysis before it's shared. Environmental health and safety owns emissions. The CSR manager collects and chases, but shouldn't be the one explaining every miss.
-
Step 4 Put a trend line on every rolling measure
Rolling 12-month figures move slowly by design, so quarter-on-quarter changes always look small. A line chart running back to the start of your data, with a trend line, shows a drift that four separate quarterly snapshots will explain away. Give the CSR committee that view every quarter.
List of CSR KPIs
Four targets have a published benchmark behind them: matching gift participation and community investment from CECP, and hotline reports and case closure time from NAVEX. Set the rest from your own history.
| KPI Name | Typical Target | Description / Calculation |
|---|---|---|
| Employee Volunteer Participation Rate | ≥ 35% (starting point) | Employees with at least one volunteer hour in the last 12 months divided by month-end headcount. CECP's 2024 average was 25%. |
| Volunteer Hours per Employee | ≥ 4.5 a year (starting point) | Volunteer hours in the last 12 months divided by average headcount. CECP's 2024 median was 1.8. |
| Matching Gift Participation Rate | ≥ 21% (CECP 2024 average 21%) | Employees with a company-matched gift in the last 12 months divided by headcount. |
| Community Investment % of Pre-Tax Profit | ≥ 1% (CECP 2024 median 0.78%) | Cash, foundation and in-kind community investment over 12 months divided by pre-tax profit for the same 12 months. |
| Supplier Code of Conduct Audit Coverage | ≥ 95% (starting point) | High-risk suppliers audited in the last 24 months divided by all high-risk suppliers. |
| Supplier Corrective Actions Closed On Time | ≥ 90% (starting point) | Corrective actions closed by the agreed date divided by corrective actions due in the month. |
| Code of Conduct Training Completion | ≥ 97% (starting point) | Employees trained in the last 12 months divided by headcount. New starters count from day 30. |
| Ethics Hotline Reports per 100 Employees | ≥ 1.65 (NAVEX 2025 median 1.65) | Reports through all speak-up channels over 12 months divided by average headcount, times 100. |
| Ethics Case Closure Time | ≤ 28 days (NAVEX 2025 median 28) | Median calendar days from report to case closed, for cases closed in the month. Lower is better. |
| Women in Management | ≥ 40% (starting point) | Women in people-manager roles divided by all people managers. |
| Adjusted Gender Pay Gap | ≤ 2% (starting point) | One minus women's average base pay divided by men's, within the same grade and location, weighted by headcount. Lower is better. |
| Scope 1 and 2 Emissions Reduction | ≥ 20% vs 2023 (starting point) | One minus the last 12 months of Scope 1 and 2 emissions divided by the 2023 baseline. |
For context on the people measures, the Bureau of Labor Statistics counts women as 41.8% of people employed in US management occupations in 2025, against 47.1% of everyone employed. Your own workforce mix matters more than that national figure, so the 40% target here is a starting point. Our human resources dashboard example covers the hiring and retention numbers that feed it.
Why CSR Dashboards Matter
Most of these twelve get a serious look once a year, when the impact report is due, and each by a different team: community relations, finance, procurement, compliance, HR. Reviewed one team at a time, the numbers never show that one team's good news is another team's problem.
A speak-up campaign raises hotline reports, which is the point, and pushes case closure time up, which isn't. Spreading purchasing across new suppliers cuts one kind of risk and drops audit coverage overnight. A good profit year makes a fixed giving budget look stingy. And promoting more women into first-line management can widen the adjusted pay gap for a while, because new managers start near the bottom of the grade's pay range. None of that is a reason not to do it. It's a reason to know it's coming before the committee does.
The 12 months to September 2026 logged 10,892 volunteer hours, a little more than the year before. For a year, hours said everything was fine. The board says something more useful: 765 people put them in, up from 679 at the low point, and most of the new ones work on a plant floor.
Building it in SimpleKPI
Build this dashboard yourself with SimpleKPI's KPI dashboards. The mechanics are the same whatever you track:
- KPIs: each one gets a target, an entry frequency and tags, so you can report by team, site, product or whatever you split the numbers by.
- Data: type numbers in, import a spreadsheet, or use an integration or the API. The dashboard updates as each number lands, so daily and monthly KPIs sit side by side.
- Reports: scheduled KPI reports email the numbers to people who never log in.
- AI: Kip, the built-in AI, suggests targets and flags indicative benchmarks (AI estimates, not peer data) once some history builds up.
- Price: $79 a month for unlimited users and KPIs, as one flat price, with a 14-day free trial and no card needed.