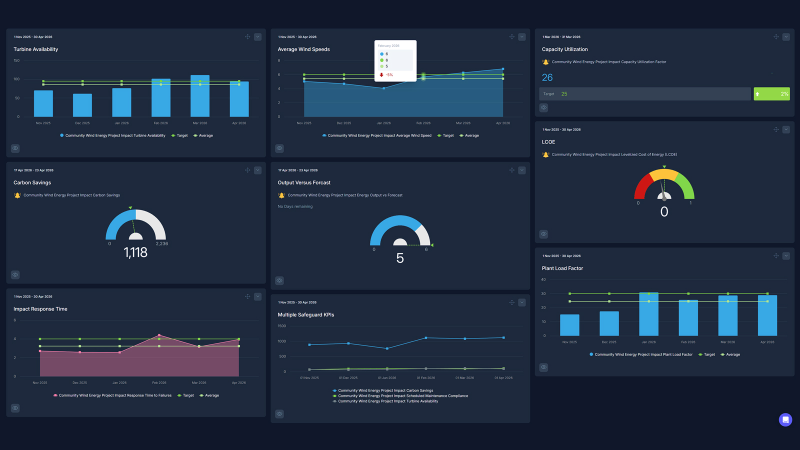
Community Wind Turbine Performance Dashboard
It's the January board meeting of a farmer-owned wind co-op, and the treasurer has the December numbers. Generation is down by more than a third on the December before. Somebody asks what the members will ask at the annual meeting: was it the wind, the grid or the turbines? Without the right numbers on one page, nobody in the room can say for sure.
The national figures show how much the weather alone can move. EIA puts the capacity factor of US utility-scale wind at 34.2% for 2025, almost exactly the 34.3% of 2024. Inside the year it swung from 44.2% in March 2025 to 22.9% in September, and that August and September both came in below the same months of 2024.
Small projects have less room for bad luck. PNNL found that 146 distributed wind projects using midsize and large turbines averaged a 24% capacity factor in 2024, with several in the Midwest losing output to maintenance outages. And the grid takes its share. Berkeley Lab's 2026 wind technology data put 2025 curtailment at 9.4% of potential wind output in SPP, 4.7% in ERCOT and 2.9% in MISO.
The co-op on this dashboard is made up, and its monthly figures are modeled. Capacity factor and curtailment targets have a published benchmark behind them. The rest are starting points.
What is a Community Wind KPI Dashboard?
Overview
A community wind KPI dashboard tells the owners how much power their turbines sold, why it was more or less than budget, what it cost to produce, and how much of the money stayed in the county.
It starts with the wind. Average hub-height wind speed has no target, because nobody controls it, but it's the first thing to check when output falls short.
Then the two things that stand between the wind and the meter. Turbine availability shows whether the machines were ready to run. Curtailment rate shows how much of what they could have made the grid wouldn't take.
What's left is the output. Net generation is the MWh sold at the revenue meter, and capacity factor turns it into a percentage of what 10 MW could produce running flat out, so you can compare it with the fleet.
Then the money. Energy sales revenue is the cash in. O&M cost per MWh, over a rolling 12 months, is what each MWh cost to keep the turbines turning.
Last, what the project exists to do locally. Community benefit payments add up the county production tax, landowner royalties and the community fund. Homes powered translates a year of output into a number people at the county fair understand. Safety incidents count injuries on the site, contractors included.
Who benefits from this dashboard?
- Co-op Board and Treasurer: Revenue, O&M cost per MWh and the reserve decide what can be distributed to members. The wind, availability and curtailment lines tell them how to explain it.
- Asset Manager: Often a part-time or contracted role on a project this size. Availability against the O&M contractor's report, and curtailment against the offtaker's dispatch records, are the two numbers they get paid to argue about.
- O&M Contractor's Site Lead: Availability and safety incidents are their scorecard. A turbine that's been down for a week shows up here before it shows up in the invoice dispute.
- County and Township Officials: Community benefit payments move with every MWh. A weak wind year reaches the county budget too, and they'd rather hear it in spring than at tax time.
- Member-Investors: Homes powered and the 12-month trend in generation are what most of them read. They want to know whether a bad year was bad luck or a bad turbine.
Take net generation from the offtaker's settlement statement, not from the turbines' SCADA totals. SCADA counts output at each turbine, before collection-line and transformer losses, so it reads higher than what you were paid for. A capacity factor built on it will never reconcile with revenue.
Dashboard Example Overview
The example project has four 2.5 MW turbines, 10 MW in all, commissioned in 2014 on farmland in southwest Minnesota. It sells every MWh to a generation and transmission cooperative under a long-term power purchase agreement, and reports monthly against ten KPIs:
- Net Generation: MWh delivered at the revenue meter in the month, from the settlement statement. The target is the P50 budget, the output the project is expected to beat half the time.
- Capacity Factor: Net generation divided by 10 MW times the hours in the month. It takes month length out of the comparison and lets you set the project against EIA and Berkeley Lab figures.
- Turbine Availability: Turbine-hours available to run, divided by total turbine-hours. Time-based, and counted from the owner's side, so waiting for a crane counts against it.
- Curtailment Rate: Curtailed MWh divided by net generation plus curtailed MWh. Energy the turbines could have made but the grid wouldn't take.
- Average Hub-Height Wind Speed: Mean wind speed at hub height, in meters per second. Context only, with no target.
- Wind O&M Cost per MWh: The last 12 months of service contract, repairs, insurance, reserve contributions and condition monitoring, divided by the last 12 months of net generation. A big repair paid out of the reserve isn't counted twice.
- Energy Sales Revenue: Net generation times the PPA price: $46.00 per MWh through 2025, $46.92 from January 2026.
- Community Benefit Payments: The county wind energy production tax, which Minnesota sets at $0.36 per MWh for systems between 2 and 12 MW, plus landowner royalties of 4% of revenue and $1.00 per MWh to a community fund.
- Site Safety Incidents: OSHA-recordable injuries at the site, owner and contractor staff together.
- Homes Powered Equivalent: The last 12 months of net generation divided by 10,791 kWh, EIA's average for a US residential customer in 2022.
The first year is the one the budget was built on. From October 2024 to September 2025 the project sold 32,030 MWh, a 36.6% capacity factor, just over its 36% target. March and April 2025 were the best months, at 45.0% and 45.1%. April was also the first year's worst month for curtailment, at 4.1%, because the wind is strong and spring demand is light. Availability held at 97 to 98% except in February, when icing took it to 95.8%. That was also the month a technician slipped on an iced tower pad, the first year's one recordable incident.
Then the wind dropped off. July 2025 averaged 6.5 m/s at hub height and August 6.2, and the August capacity factor fell to 22.0%. Nothing at the site was broken: availability was 97.2% that month. The weak late summer showed up nationally in EIA's numbers too.
The weak wind ran on into the winter. November 2025 averaged 7.6 m/s, against 8.3 a year earlier. And in October the transmission owner began rebuilding a nearby line that carries the project's output. With the line out, the turbines were dispatched down whenever the remaining lines were full. Curtailment went from 5.8% in October to 13.6% in November, 15.2% in December, 14.1% in January and 11.8% in February, roughly four to five times the target.
In mid-December, the gearbox on one turbine failed. One turbine is a quarter of the project, and a crane in a Minnesota winter takes time to book. It was back on line on January 22. Availability fell to 83.4% in December and 80.1% in January. A technician hurt a hand during the gearbox swap, the second recordable incident in two years.
Put together, November 2025 to February 2026 produced 8,125 MWh against 11,908 the winter before, down 32%. Revenue for those four months was $377,441, against $547,768. December's capacity factor was 24.8%, against 39.0% a year earlier, and community benefit payments for the month were $5,910 instead of $9,293.
Recovery came in pieces. The line was back in service in February, and curtailment fell to 4.9% in March, 3.4% in April and 1.9% in June. Availability has been 97 to 98% every month since. The wind came most of the way back: April 2026 hit a 43.2% capacity factor, against 45.1% the April before, and April to June still trailed 2025 by 4 to 9% because the wind stayed a little lighter, 8.3 m/s in April against 8.5. July to September 2026 beat the weak late summer of 2025, with 1,932 MWh in August against 1,639.
Over the twelve months to September 2026, the project sold 27,614 MWh, a 31.5% capacity factor, and $1,289,658 of power, against $1,473,380 the year before. Homes powered fell from 3,083 in October 2024 to a low of 2,485 in June 2026 and stands at 2,559, short of its 2,900 target. It will climb as the curtailed winter months roll out of the 12-month window.
One number won't come back. The gearbox was paid for out of the major maintenance reserve, and it emptied it. To rebuild it, the board raised the monthly reserve contribution from $5,000 to $11,000. The insurer added $900 a month at the April renewal, and the co-op now pays $1,200 a month for drivetrain condition monitoring, to catch the next gearbox before it fails in January. With the service contract's annual escalator on top, monthly O&M went from about $34,400 in the first year to about $43,000 since April. O&M per MWh, $12.28 in October 2024, is $18.86 now. Even on a full year at the first year's 32,030 MWh, it would settle near $16.10, well above the $13 target. The board decided that was the price of a 12-year-old drivetrain and kept the target where it is, as a reminder.
Creating a Community Wind Dashboard in SimpleKPI
-
Step 1 Pin down what counts as available
IEC 61400-26-1 describes time-based availability, counted in hours, and production-based availability, counted in the MWh lost. The figure in the O&M contractor's monthly report is calculated under the contract's own exclusions. The owner's figure should count every hour a turbine couldn't run, including the wait for parts and the crane, and should treat a curtailed turbine as available. Write down which one the board sees, or the two will be argued over every month.
For more on choosing and defining measures, see the KPI selection guide.
-
Step 2 Match each KPI to the settlement statement, SCADA or the books
The offtaker's settlement statement owns net generation and revenue. SCADA owns availability and hub-height wind speed. Curtailment comes from the dispatch instructions, kept by the asset manager. The treasurer owns O&M cost and the benefit payments. Set direction as you add them: curtailment, O&M cost per MWh and safety incidents improve as they fall, and wind speed has no direction at all.
-
Step 3 Split every shortfall into wind, grid and turbines
Each board meeting gets the same view: net generation against the monthly P50 budget, with wind speed, curtailment and availability beside it, all compared with the same month last year. If the wind was normal and curtailment and availability were on target, the shortfall is in the turbines themselves, and that's a conversation with the O&M contractor, not the weather.
-
Step 4 Report the community numbers on a 12-month window
Benefit payments and homes powered swing with the season, and the county production tax is settled once a year anyway. Show them to members and local officials as rolling 12-month totals, so a calm August doesn't read as a broken promise and a windy March doesn't set expectations the project can't keep.
List of Community Wind KPIs
Capacity factor and curtailment rate have published figures to compare against, from EIA and Berkeley Lab, though the capacity factor target comes from this project's own P50 budget. Every other target here is a starting point for this project, so set yours from your own P50 budget and operating history.
| KPI Name | Typical Target | Description / Calculation |
|---|---|---|
| Net Generation | 2,630 MWh a month (starting point) | MWh delivered at the revenue meter, from the settlement statement. Set monthly P50 targets for a seasonal site. |
| Capacity Factor | ≥ 36% (starting point, from the project's P50 budget); Berkeley Lab: 2014-built projects 31.9% in 2025; EIA US fleet 34.2% in 2025 | Net generation divided by nameplate MW times hours in the period. |
| Turbine Availability | ≥ 97% (starting point) | Turbine-hours available to generate divided by total turbine-hours. Time-based, owner's view. |
| Curtailment Rate | ≤ 3% (Berkeley Lab: MISO 2.9% in 2025) | Curtailed MWh divided by net generation plus curtailed MWh. Lower is better. |
| Average Hub-Height Wind Speed | No target (context) | Mean wind speed at hub height across the turbines, in m/s. |
| Wind O&M Cost per MWh | ≤ $13 (starting point) | Last 12 months of O&M cost, including insurance and reserve contributions, divided by the last 12 months of net generation. Lower is better. |
| Energy Sales Revenue | $121,000 a month (starting point) | Net generation times the PPA energy price. |
| Community Benefit Payments | $8,400 a month (starting point) | County production tax plus landowner royalties plus community fund contributions. |
| Site Safety Incidents | 0 (starting point) | OSHA-recordable injuries at the site, owner and contractor staff. Lower is better. |
| Homes Powered Equivalent | ≥ 2,900 (starting point) | Last 12 months of net generation in kWh divided by 10,791 kWh, EIA's average annual use per US home. |
If you want a longer list to choose from, there's a spreadsheet of 11 community wind KPIs from an earlier version of this example, laid out for import. It includes some that aren't on this board, such as levelized cost of energy, carbon savings and scheduled maintenance compliance.
Why Community Wind Dashboards Matter
On a project with four turbines, every number leans on the others. Availability and O&M cost pull hardest against each other. The cheapest way to hold down cost per MWh is to put off the inspection, and the cheapest way to lift winter availability is to hurry the repair. Neither is cheap for long. The BLS describes technicians climbing towers 200 feet or higher on fall protection, and expects the occupation to grow 30% from 2025 to 2035. A rushed gearbox swap in January is where the safety incident line moves.
Curtailment and revenue look like a simple trade, but the community feels it too. Every MWh the grid turns away is a MWh nobody pays production tax or royalties on, and in Minnesota 80% of that tax goes to the county and 20% to the city or township. A line rebuild 20 miles away can cut the township's income without anything at the project going wrong.
Capacity factor has its own slow pull: age. Berkeley Lab's data show the median project producing 93% of its year-two capacity factor by year ten. On a 12-year-old project, a falling capacity factor could be age, wind, the grid or a turbine that needs work. The wind speed, curtailment and availability lines are how you tell them apart.
When a member asks at the annual meeting why the check was smaller, the answer should fit on three lines of this dashboard. This year's version: wind lighter than normal from July, four months of a line rebuild, and a gearbox that kept one turbine in four out for nearly six weeks.
If you're tracking how buildings use energy rather than how turbines make it, the energy management dashboard example covers that side of the meter.
Building it in SimpleKPI
Build this dashboard yourself with SimpleKPI's KPI dashboards. The mechanics are the same whatever you track:
- KPIs: each one gets a target, an entry frequency and tags, so you can report by team, site, product or whatever you split the numbers by.
- Data: type numbers in, import a spreadsheet, or use an integration or the API. The dashboard updates as each number lands, so daily and monthly KPIs sit side by side.
- Reports: scheduled KPI reports email the numbers to people who never log in.
- AI: Kip, the built-in AI, suggests targets and flags indicative benchmarks (AI estimates, not peer data) once some history builds up.
- Price: $79 a month for unlimited users and KPIs, as one flat price, with a 14-day free trial and no card needed.