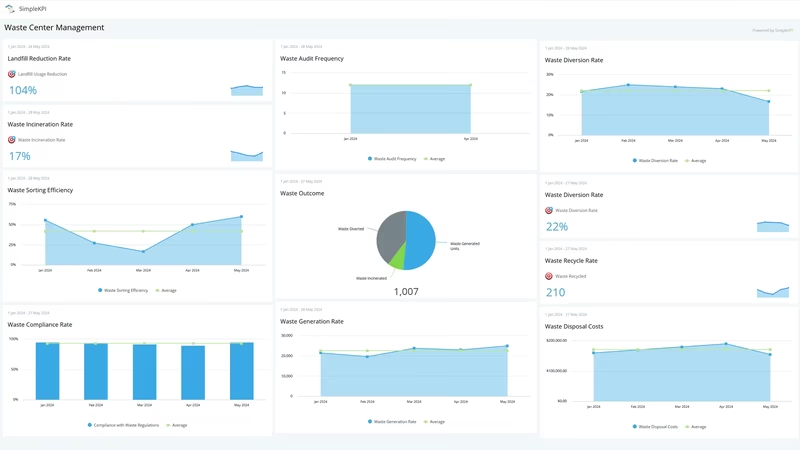
Waste and Recycling Center Performance Dashboard
The county's annual recycling report goes to the commissioners with 33% on the front page. Down at the end of the sort line, the residue falls into a bunker and gets pushed into the next transfer trailer with the trash. Nobody has ever weighed it on its own. Nobody has needed to, because the report has always looked fine.
33% sounds right because it's close to the national figure. The EPA's most recent national data, for 2018, counted 292.4 million tons of municipal solid waste, with 32.1% recycled or composted and 50% landfilled. In 2020 EPA set a national goal of a 50% recycling rate by 2030, and named three measures to sit beside it: recycled commodity contamination, processing yield and commodity value.
Residue has a long history of going uncounted. EPA's 1997 guide, Measuring Recycling: A Guide for State and Local Governments, said its standard method didn't require residues to be tracked, because the effort might not be worth it. Contamination fares little better. The Recycling Partnership's 2020 State of Curbside Recycling report found that about 35% of communities knew their inbound contamination rate. Those that did averaged 16.9% by weight.
The center in this example is made up: a county-run recycling and transfer center in the Southeast. Its monthly figures are modeled, not taken from a real facility, and they follow what happens when a center starts weighing the residue it used to estimate. Two targets below lean on a published figure, and the table says which.
What is a Waste Center KPI Dashboard?
Overview
A waste center KPI dashboard shows how many of the tons that cross your scale actually stay out of the landfill, what it costs to keep them out, and whether the crew finished the month without an injury.
It starts at the scale house. Inbound tons received is the volume everything else is read against: trash for transfer, curbside single-stream, yard waste and resident drop-off. Truck turnaround time is how long a collection truck spends between the inbound and outbound tickets, and haulers notice every minute of it.
Then the tip floor. Inbound contamination rate is the share of a single-stream load that never belonged in a recycling cart: bags of trash, garden hoses, propane cylinders, clothes.
Then the sort line. Sort line uptime is how many scheduled hours the line actually ran. MRF residue rate is the weight of everything the line sends to the landfill, as a share of what it processed.
Then the money. Commodity revenue per ton shows what the bales earned after the buyer's deductions, and cost per ton processed shows what it cost to make them. Landfill diversion rate sits over the top and says how much of the whole intake stayed out of the ground. TRIR sits beside it, because a recycling center that hits its diversion target by hurting people hasn't hit anything.
Who benefits from this dashboard?
- Solid Waste Director: Diversion rate, cost per ton and commodity revenue are the numbers the commissioners and the budget office ask about. Seeing them together means a lower diversion rate arrives with its explanation attached.
- Scale House Supervisor: Truck turnaround time and inbound tons are theirs. A queue of packer trucks on the access road is a phone call from a hauler before it's a number.
- MRF or Sort Line Manager: Uptime and residue rate show whether a bad week came from the stream or the machinery. Plastic bags wrapped around the screens usually mean both.
- Recycling Coordinator: The contamination rate, split by hauler and route, tells them where to send cart taggers and what to put on the next mailer.
- Safety Officer: The rolling TRIR and the OSHA log behind it show whether a new job on the line, like hand-sorting at the infeed, has brought new injuries with it.
If your residue rate comes in lower than your inbound contamination rate, one of them isn't being measured. Everything that arrived as contamination leaves either as residue or inside a bale, and a buyer who finds it in the bale will dock the price or reject the load.
Dashboard Example Overview
The center serves a county of about 240,000 people. It runs one scale house with two lanes, a transfer floor for trash bound for a regional landfill, a single-stream sort line on one shift, a yard waste grinding pad and a resident drop-off area for cardboard, scrap metal and electronics. About 40 people work there, and it takes in between roughly 10,700 and 13,000 tons a month. It reports monthly against nine KPIs:
- Inbound Tons Received: Every ton weighed in at the scale house, across all four streams. It has no target, because the center doesn't choose how much the county throws away. It's here because the diversion rate and cost per ton can't be read without it.
- Landfill Diversion Rate: Single-stream tons received minus weighed residue, plus yard waste ground for mulch and compost, plus drop-off recyclables, divided by inbound tons received. The residue deduction is the whole story of this example.
- Inbound Contamination Rate: The weight of non-program material in monthly audit samples of single-stream loads, divided by the sample weight. Samples are pulled from both contracted haulers' trucks on a fixed schedule.
- MRF Residue Rate: Weighed residue from the sort line, divided by single-stream tons processed. It includes contamination and any good material the line missed.
- Commodity Revenue per Ton: Bale sales revenue, net of the buyer's quality deductions, divided by tons of bales shipped. It moves with markets, but also with how clean the bales are.
- Cost per Ton Processed: Sort line labor, equipment, maintenance, and residue hauling and disposal, divided by single-stream tons processed.
- Truck Turnaround Time: Average minutes from inbound to outbound scale ticket for collection trucks. Haulers are paid by the route, so a slow tip floor costs them money.
- Sort Line Uptime: Run hours divided by scheduled run hours. Most of the lost time here is crews cutting film and bags off the screens.
- TRIR: OSHA recordable cases times 200,000, divided by hours worked, on a rolling 12 months.
For the first six months, the board looks calm. From October 2024 to March 2025, diversion runs between 32.4% and 33.9%. Inbound contamination reads 8.0% every month and residue reads 5.0% every month. Those flat lines were the giveaway. The 8.0% came from a single audit in 2022, and the 5.0% was the residue figure in the sort line's original design spec. Real residue was riding to the landfill in transfer trailers, booked as trash.
In April 2025 the center puts a dedicated roll-off at the end of the line, gives residue its own material code at the scale, and starts monthly inbound audits. The first weighed month shows residue at 22.2% and contamination at 19.5%. Diversion falls from 32.4% in March to 29.9%. Cost per ton processed jumps from $77.86 to $90.39, because residue hauling and disposal are charged to recycling for the first time. Nothing at the center got worse in April. It just got counted.
The low point is July 2025, at 28.0%. The director takes the new number to the commissioners anyway, with the old method set out beside it, and asks for a year to bring the real figure up.
The fixes had started a month earlier. In June 2025 both haulers start tagging carts that contain bags, hoses or food, and the recycling coordinator sends audit results to each hauler by route. In August the tip floor crew starts inspecting and photographing every single-stream load as it's dumped. Contamination falls from 18.6% in June to 15.7% by September.
That inspection cost truck time, and the haulers said so. Turnaround goes from 13.0 minutes in July 2025 to 18.1 in August and 18.7 in September. In January 2026 inspections move to a staging bay off the scale lane, and turnaround drops to 14.6. It never gets back to the 12.7 minutes of October 2024, and the center decided that was a price worth paying.
In November 2025 a four-person pre-sort crew starts at the infeed, pulling bags, hoses and film before they reach the screens. Cost per ton reaches $93.68 that month. The crew also brings a new risk: a laceration in November and a needle-stick in December, which push the rolling TRIR from 7.2 to 9.5. Puncture-resistant gloves and a sharps container at the pre-sort stand follow, and there isn't another recordable case through September 2026.
Cleaner material shows up in the machinery and the bales. Uptime climbs from 85.5% in April 2025 to 90.3% in February 2026, after the worn screens are replaced, and reaches 92.5% by September 2026. The buyer stops docking the mixed paper, and commodity revenue per ton rises from $81.06 in April 2025 to $102.26 in September 2026. In March 2026 the county adds recycling carts at apartment complexes, and inbound tons for April 2026 reach 12,683, against 12,220 a year earlier.
By September 2026, contamination is 10.9%, residue is 12.6%, rolling TRIR is 4.4 and diversion is 32.3%, up from 29.3% the September before. That's a shade under the 32.7% reported in October 2024, and it's a far better number, because the residue is now on a scale ticket. Cost per ton processed ends at $85.22, still above the $76.84 of October 2024. The old figure never paid for the residue.
Creating a Waste Center Dashboard in SimpleKPI
-
Step 1 Give residue its own scale ticket
Put residue in its own roll-off or trailer, give it its own material code in the scale software, and never let it leave in a load of trash. Until it has a ticket, your residue rate and diversion rate are estimates, however many decimal places they show. While you're in the scale software, check that yard waste, drop-off recyclables and single-stream each have their own code too.
If you're still settling which measures belong on the board, our guide to choosing KPIs covers the trade-offs.
-
Step 2 Audit inbound loads on a calendar, not after a complaint
Pick a sample size, a schedule and a split by hauler and route, and keep them the same month after month. An audit run only when a buyer complains will always find contamination high, and one run in a quiet week will always find it low. Neither is a trend.
-
Step 3 Split the numbers between the scale house, the coordinator and finance
The scale software owns tons, turnaround and residue. The recycling coordinator owns the audits. Finance owns cost per ton and the buyer settlements behind revenue per ton, and the safety officer owns the OSHA log and hours worked. Set the direction as you go: contamination, residue, cost per ton, turnaround and TRIR all improve as they fall.
-
Step 4 Show the haulers contamination and turnaround together
The sort line needs a weekly look at uptime, residue and contamination. The haulers' monthly meeting needs contamination by route and turnaround time on the same screen, so the trade between the two is in front of everyone. The director needs a monthly view of diversion, cost per ton and commodity revenue, with notes on any change in how a number is measured.
List of Waste Center KPIs
Only TRIR and inbound contamination have a published US figure to compare against, and the contamination figure is an average, not a target. The rest are starting points from this example, to replace with your own once you have a year of weighed data.
| KPI Name | Typical Target | Description / Calculation |
|---|---|---|
| Inbound Tons Received | No target (context) | Total tons weighed in at the scale house across all streams. |
| Landfill Diversion Rate | ≥ 35% (starting point) | Single-stream tons minus weighed residue, plus yard waste and drop-off recyclables, divided by inbound tons received. |
| Inbound Contamination Rate | ≤ 10% (The Recycling Partnership average 16.9%) | Weight of non-program material in audit samples divided by total sample weight. Lower is better. |
| MRF Residue Rate | ≤ 12% (starting point) | Weighed residue sent to landfill divided by single-stream tons processed. Lower is better. |
| Commodity Revenue per Ton | ≥ $95 (starting point) | Bale revenue net of buyer deductions divided by tons of bales shipped. |
| Cost per Ton Processed | ≤ $85 (starting point) | Sort line operating cost, including residue hauling and disposal, divided by single-stream tons processed. Lower is better. |
| Truck Turnaround Time | ≤ 15 minutes (starting point) | Average minutes from inbound to outbound scale ticket for collection trucks. Lower is better. |
| Sort Line Uptime | ≥ 92% (starting point) | Sort line run hours divided by scheduled run hours. |
| TRIR | ≤ 5.0 (BLS 2024, private MRFs 5.9) | OSHA recordable cases times 200,000 divided by hours worked, rolling 12 months. Lower is better. |
Why Waste Center Dashboards Matter
A recycling center is built to move tons, and most of its numbers reward moving more of them. The scale house wants trucks through fast. The sort line wants a full infeed. The annual report wants a high diversion rate. Contamination is what all three quietly push into the landfill, which is why it has to be measured where nobody can lose it.
The trades on this board are real. Inspecting loads cuts contamination but slows the trucks, and slow trucks are a cost to the haulers that comes back at contract time. A pre-sort crew lifts uptime and bale quality but adds labor to cost per ton and puts hands near sharps. Weighing residue drops the diversion rate on the day you start, and raises cost per ton, because disposal that used to hide in the transfer budget lands on recycling.
Every ton of that residue still pays a gate fee somewhere. EREF's analysis of 2024 landfill tipping fees, from 351 landfills and as reported by Waste Advantage, put the national average at $62.28 per ton, after a 10% rise. And the work itself carries a cost: BLS recorded 5.9 recordable cases per 100 full-time workers at private materials recovery facilities in 2024, against 2.3 across private industry.
A center that reads diversion, residue, cost and safety on one screen can explain a falling diversion rate before anyone asks. For a broader view of a county's services, see the local government dashboard example, and for an organization's own waste and emissions, the environmental sustainability example. Start with the roll-off at the end of the line. It costs a container and a scale code, and it's the only way to know what your diversion rate really is.
Building it in SimpleKPI
Build this dashboard yourself with SimpleKPI's KPI dashboards. The mechanics are the same whatever you track:
- KPIs: each one gets a target, an entry frequency and tags, so you can report by team, site, product or whatever you split the numbers by.
- Data: type numbers in, import a spreadsheet, or use an integration or the API. The dashboard updates as each number lands, so daily and monthly KPIs sit side by side.
- Reports: scheduled KPI reports email the numbers to people who never log in.
- AI: Kip, the built-in AI, suggests targets and flags indicative benchmarks (AI estimates, not peer data) once some history builds up.
- Price: $79 a month for unlimited users and KPIs, as one flat price, with a 14-day free trial and no card needed.