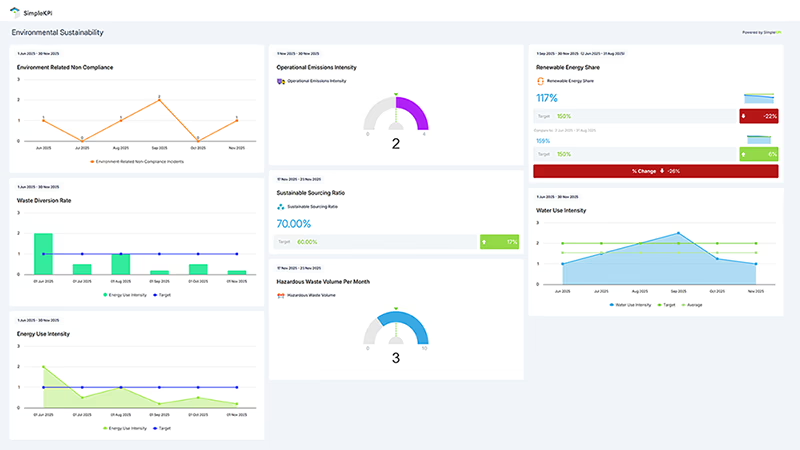
Environmental Sustainability Performance Dashboard
The email comes from your biggest customer's procurement team: please complete the CDP climate questionnaire by July. Scope 1, Scope 2, intensity, targets. Your sustainability lead opens the monthly report, sees an emissions intensity well down on last autumn, and starts filling in boxes. A week later the maintenance supervisor asks why nobody has ever asked him for the refrigerant log.
That email is common now. CDP says more than 270 major buyers asked about 45,000 suppliers for environmental data through its supply chain program in 2025, and more than 23,100 companies, cities, states and regions disclosed through CDP that year. For plenty of mid-sized manufacturers it's the first time anyone outside the building has checked the numbers. A plant burning natural gas for process heat usually sits far below the 25,000 metric tons of CO2e a year that brings most facility types into EPA's Greenhouse Gas Reporting Program, so no regulator has been asking either.
Refrigerants are where the gaps usually hide. The GHG Protocol Corporate Standard counts HFCs leaking from refrigeration and air conditioning equipment as Scope 1 fugitive emissions, but they arrive on an HVAC contractor's invoice, not a utility bill. They're also harder to overlook than they were. Since January 1, 2026, EPA's HFC leak repair and reporting rules cover appliances holding 15 pounds or more of HFC refrigerant, a threshold low enough to catch plenty of ordinary process chillers.
Electricity is the other half, and where you are matters. In EPA's eGRID data for 2023, released in 2025, the RFC West subregion averaged 916 pounds of CO2e per megawatt-hour, against 771 for the US as a whole. The same megawatt-hour carries almost a fifth more emissions there.
The company on this board is fictional, and its monthly figures are modeled rather than taken from a real business. Only one target below, waste diversion, can be read against a published bar. The other seven are starting points.
What is an Environmental Sustainability KPI Dashboard?
Overview
An environmental sustainability KPI dashboard puts a company's greenhouse gas emissions next to the energy, water and waste behind them, so you can tell a real reduction from a change in the accounting.
It starts with what comes in the door. Total energy consumption adds up electricity, natural gas and vehicle fuel in one unit. Renewable electricity share shows how much of the power is contracted or generated as renewable.
Then what that energy turns into. Scope 1 covers what you burn and leak yourself: furnaces, boilers, trucks, refrigerant. Market-based Scope 2 covers the electricity you buy, after your contracts. Emissions intensity divides both by revenue, which makes one year comparable with the next and also, as this example shows, makes the trend easy to flatter.
Water withdrawal and waste diversion rate cover the other resources a plant uses up. Reportable environmental incidents is the check that none of it is spilling into the permit file.
This board covers a company's whole operational footprint. If you're tuning individual buildings with EUI and ENERGY STAR scores, the energy management dashboard example goes deeper. For the social side of ESG, see the corporate social responsibility example.
Who benefits from this dashboard?
- EHS Manager: Owns the inventory and the incident log. The monthly view catches a missing fuel card statement or a permit exceedance long before the annual report is due.
- Plant and Maintenance Managers: Refrigerant top-ups, compressed air leaks and cooling tower blowdown all show up here in tons and gallons, a language the capital budget understands.
- CFO or Controller: Intensity uses their revenue figure, and the green tariff is their signature. They need to see what a price increase does to the ratio before an auditor does.
- Account Managers: When a customer's questionnaire arrives, the answers are already on the board, with the definitions behind them.
- CEO and Board: Absolute emissions against the restated base year answer the question investors and big customers keep asking: is it actually going down?
Ask maintenance for the refrigerant service records before you sign off any Scope 1 figure. Every pound a technician adds to top up a chiller or cold room is a pound that leaked, and that's your fugitive emissions number. If the log doesn't exist, start one this month.
Dashboard Example Overview
The company makes molded plastic and die-cast aluminum parts for appliance and HVAC manufacturers. It has three plants in the Ohio Valley, all buying power in eGRID's RFC West subregion, about 700 employees, roughly $250 million in annual sales and 12 trucks delivering to customers' assembly lines. It reports monthly against eight KPIs:
- Scope 1 Emissions: Direct emissions in metric tons of CO2e: natural gas burned in furnaces and boilers, diesel in the company's own trucks, and refrigerant leaked, calculated as pounds topped up multiplied by the refrigerant's global warming potential.
- Market-Based Scope 2 Emissions: Grid electricity not covered by a green tariff or certificates, multiplied by a residual mix emission rate. The location-based figure, using the eGRID subregion rate, is kept alongside it, as the GHG Protocol Scope 2 Guidance asks.
- Scope 1 and 2 Emissions Intensity: Scope 1 plus market-based Scope 2, divided by net revenue in millions of dollars for the month. It's the figure most customer questionnaires ask for, and the one on this board that misled.
- Total Energy Consumption: Electricity in megawatt-hours, plus natural gas and diesel converted to megawatt-hours. It moves with production volume and with the seasons.
- Renewable Electricity Share: On-site solar used, plus green tariff megawatt-hours, divided by total electricity used.
- Water Withdrawal: Municipal water bought plus well water pumped, in thousands of gallons. Most of it goes to cooling towers on the die-casting cells.
- Waste Diversion Rate: Non-hazardous solid waste reused, recycled or composted, as a share of all non-hazardous solid waste, by weight from the haulers' tickets. Waste-to-energy counts as disposal.
- Reportable Environmental Incidents: Permit limit exceedances plus spills or releases that had to be reported to a regulator. The target is zero.
The two years split into before and after the company found out what it wasn't counting.
In October 2024, Scope 1 is 484 tons, market-based Scope 2 is 1,800 tons, and intensity is 117.7 tons per million dollars of revenue. Scope 1 means natural gas and nothing else, because that's all the first inventory, built from utility bills, picked up. Renewable electricity share is 5.0%, all from rooftop solar at one plant.
By April 2025 intensity is down to 108.7, a fall of almost 8% in six months, and the monthly report calls it progress. But reported Scope 1 and 2 together went up, from 2,284 tons in October to 2,312 in April. Revenue did the work. A 6.5% price increase in January, passed on to cover resin and aluminum costs, cut the ratio without saving a single ton.
In June 2025, preparing that first CDP response, the company has an outside engineer walk all three plants against the GHG Protocol's list of source types. Two are missing from Scope 1: diesel from the delivery fleet, and refrigerant leaking from process chillers and cold rooms. Together they add about 190 tons a month.
From July 2025 they're in. Scope 1 jumps from 424 tons in June to 606, intensity from 111.4 to 125.0, and total energy consumption from 6,952 to 7,544 megawatt-hours as the fleet's diesel joins it. Nothing happened at the plants that month. The team marks the change on the chart, restates the 2024 base year from fleet records and contractor invoices, and adds absolute targets for Scope 1 and Scope 2 next to the intensity one. The monthly history before July stays as reported, because nobody logged leaks by month back then.
Then the real work. From October 2025 to January 2026, every chiller gets leak testing and repairs, the two worst get new controls, and a compressed air leak survey runs in all three plants. In January 2026 two plants move onto a utility green tariff. Renewable electricity share goes from 2.2% in December to 42.0% in January, and market-based Scope 2 falls from 1,698 tons to 1,003. The location-based figure barely moves, which is exactly why both are reported.
By September 2026, intensity is 74.2, under its target of 80. Market-based Scope 2 is 1,096 tons, inside its 1,150 target, and renewable share is 45.7%. Scope 1 is 589 tons, down from 650 the September before, with refrigerant top-ups a fraction of what they were. It's still above the 560 target, because the die-casting cell added in March 2026 burns gas every shift.
That same cell is why water went the wrong way. It came with its own cooling tower, and from April to September 2026 water withdrawal sat above the 5,500 thousand gallon target every month, peaking at 6,571 in July against 5,985 in July 2025. Waste diversion climbed from 71.9% to 85.9% by March 2026, then fell to 79.4% in April when the buyer for mixed-color regrind stopped taking it. It was back to 82.7% by September, still short of 85%. And there were three reportable incidents in two years: a coolant spill in February 2025, a stormwater exceedance in August 2025 and a wastewater pH exceedance at the new cell in April 2026.
Creating an Environmental Sustainability Dashboard in SimpleKPI
-
Step 1 List every Scope 1 source before entering a number
Walk each site with four categories in hand: stationary combustion (furnaces, boilers, generators), mobile combustion (anything you own that burns fuel, forklifts included), fugitive emissions (refrigerants, fire suppression gases) and process emissions. Choose operational or financial control as your boundary and write it down. A missing category is a restatement waiting to happen.
If you're still settling which measures belong on the board, the KPI selection guide walks through the trade-offs.
-
Step 2 Trace each figure to the record that proves it
Electricity, gas and water come from utility bills, diesel from fuel card statements, refrigerant from the HVAC contractor's service records, waste from haulers' weight tickets, and incidents from the EHS log. Name an owner for each. Six of the eight improve as they fall; only renewable share and diversion rate should go up.
-
Step 3 Report Scope 2 both ways from the first month
Keep the location-based figure, from the eGRID subregion rate, in the notes or on a second chart next to the market-based KPI. When a green tariff or certificate purchase starts, the gap between the two shows how much of the reduction is contractual and how much came from using less power.
-
Step 4 Write the recalculation policy before you need it
Agree in advance what size of correction or boundary change triggers a base year restatement, and how the monthly charts will be annotated when it happens. Deciding after you've found 190 missing tons a month turns a method question into a political one.
-
Step 5 Give plants, EHS and the board different horizons
Plant managers need water, waste and incidents monthly, by site. EHS needs incidents as they happen and the full inventory monthly. Leadership needs absolute Scope 1 and 2 against the restated base year each quarter, and the customer questionnaires need year-end totals with every definition attached.
List of Environmental Sustainability KPIs
Waste diversion is the only target here with a published bar to compare against: the 90% that TRUE zero waste certification requires. Every other target is a starting point set from this company's own restated base year.
| KPI Name | Typical Target | Description / Calculation |
|---|---|---|
| Scope 1 Emissions | ≤ 560 tCO2e a month (starting point) | Natural gas, fleet fuel and refrigerant leaks in metric tons of CO2e. Refrigerant is pounds topped up multiplied by global warming potential. Lower is better. |
| Market-Based Scope 2 Emissions | ≤ 1,150 tCO2e a month (starting point) | Grid electricity not covered by green tariffs or certificates, multiplied by the residual mix rate. Report location-based alongside. Lower is better. |
| Scope 1 and 2 Emissions Intensity | ≤ 80 tCO2e per $M revenue (starting point) | Scope 1 plus market-based Scope 2, divided by net revenue in millions of dollars. Read it with the absolute figures. Lower is better. |
| Total Energy Consumption | ≤ 7,200 MWh a month (starting point) | Electricity plus natural gas and fleet diesel converted to megawatt-hours. Lower is better. |
| Renewable Electricity Share | ≥ 40% (starting point) | On-site solar used plus green tariff megawatt-hours, divided by total electricity used. |
| Water Withdrawal | ≤ 5,500 thousand gallons a month (starting point) | Municipal water bought plus well water pumped across all sites. Lower is better. |
| Waste Diversion Rate | ≥ 85% (starting point; TRUE certification requires 90%) | Non-hazardous solid waste reused, recycled or composted, divided by all non-hazardous solid waste, by weight. Waste-to-energy counts as disposal. |
| Reportable Environmental Incidents | 0 (starting point) | Permit limit exceedances plus spills or releases reported to a regulator in the month. Lower is better. |
Want the list in a spreadsheet? The environmental sustainability KPI download holds the eight measures this page started from, with descriptions, directions and review frequencies. It overlaps with the board above rather than matching it: hazardous waste volume, water use intensity and a sustainable sourcing ratio are in it, and the Scope 1 and 2 split isn't. If your operations look different, the KPI generator builds a list from a description of your business.
Why Environmental Sustainability Dashboards Matter
An emissions inventory is a sum of small numbers, each kept by someone whose real job is something else: paying bills, running trucks, fixing chillers. None of them is wrong on its own terms. The gaps only show when someone outside the company sends a questionnaire listing source types nobody thought to collect.
Several of these eight also pull against each other, and a plant manager feels it first. An air-cooled chiller saves the water a cooling tower evaporates, but it uses more electricity to do the same job. A green tariff cuts market-based Scope 2 overnight while total energy consumption stays exactly where it was. Swapping a high-GWP refrigerant for a lower one cuts fugitive emissions but usually means new equipment, which shows up in the capital budget, not on this board. And a revenue-based intensity improves with every price increase, whether or not anything changed on the shop floor.
So read them in pairs. Intensity with absolute emissions. Market-based with location-based. Water with electricity. Diversion rate with the tons going out the gate.
Most of all, put the refrigerant log, the fuel card statements and the utility bills on the same monthly cycle as the finance close. A company that counts every source each month finds its missing 190 tons in the first quarter, not in the middle of a customer questionnaire.
Building it in SimpleKPI
Build this dashboard yourself with SimpleKPI's KPI dashboards. The mechanics are the same whatever you track:
- KPIs: each one gets a target, an entry frequency and tags, so you can report by team, site, product or whatever you split the numbers by.
- Data: type numbers in, import a spreadsheet, or use an integration or the API. The dashboard updates as each number lands, so daily and monthly KPIs sit side by side.
- Reports: scheduled KPI reports email the numbers to people who never log in.
- AI: Kip, the built-in AI, suggests targets and flags indicative benchmarks (AI estimates, not peer data) once some history builds up.
- Price: $79 a month for unlimited users and KPIs, as one flat price, with a 14-day free trial and no card needed.