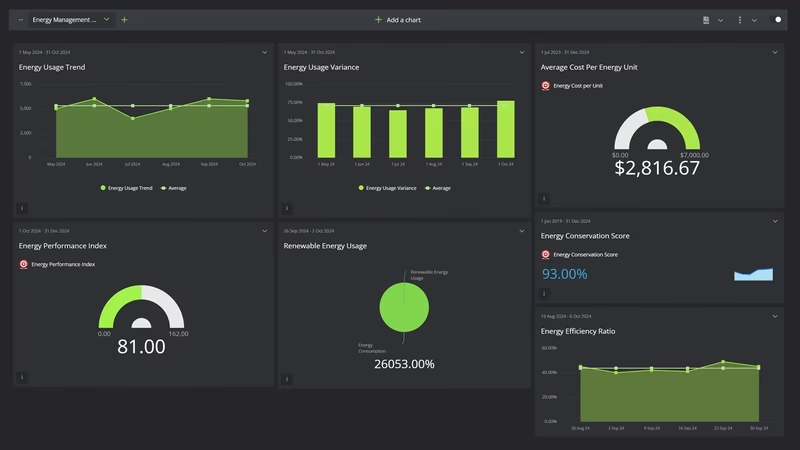
Energy Management Performance Dashboard
It's the third week of July and the chief engineer is reading last month's utility bill. One afternoon in June, a hot one with every floor occupied, set the demand charge for the whole month. Nobody saw it happen, because the meter on that building had stopped reporting two weeks earlier.
For office buildings in the South, summer is the energy year. EIA's 2018 survey of commercial buildings found that cooling used 14.2 thousand Btu per square foot in hot and very hot climates, against 2.3 in cold ones, and electricity supplied 98% of the energy used for cooling. And electricity got dearer. The average US commercial price rose from 12.75 cents per kWh in 2024 to 13.41 cents in 2025, and July 2026 came in at 14.53 cents, against 14.05 a year earlier.
The weather didn't help either. NOAA ranked meteorological summer 2025 as the 12th-warmest on record for the contiguous US, at 73.3°F. Summer 2026 was the warmest in the 132-year record, at 74.4°F. So a portfolio comparing this summer's bills with last summer's is setting a record summer against an ordinary hot one, and the raw numbers will say so.
The owner on this board is fictional, and every figure on it is modeled for illustration. The benchmarks are real. EPA says nearly 25% of US commercial building space is actively benchmarking in Portfolio Manager, and three of the targets below come from EPA's published figures. The rest are starting points.
What is an Energy Management KPI Dashboard?
Overview
An energy management KPI dashboard for a building portfolio shows how much energy each square foot used once the weather is taken out, what the peak cost you, and whether enough meters reported for any of it to be believed.
It starts with the meters, because everything downstream depends on them. Energy meters reporting is the share of meters that sent a full month of data. Below about 95%, every other number on the board is partly guesswork.
Then consumption and the weather behind it. Portfolio cooling degree days shows how hard the summer pushed. Site energy use intensity divides a year of energy by floor area, and the weather-normalized version re-runs that year at normal temperatures, so you can tell an efficient year from a mild one. Energy savings vs baseline compares that normalized figure with a fixed baseline year, which turns where the portfolio stands into how far it has come.
Next comes the peak. Portfolio peak demand is the highest 15-minute kW each building hit, summed, and it drives the demand charges. Load factor tells you how flat the load was: high means steady use, low means a spike paid for capacity the buildings barely used.
Then the money. Blended electricity cost per kWh folds demand charges into the unit price. Energy cost per square foot is the trailing 12 months, the figure an asset manager compares across buildings. Budget variance shows how far the month's bills ran from plan.
Last, the outside view. The average ENERGY STAR score is what lenders, tenants and brokers see. Renewable electricity share tracks solar and green tariff kWh as a share of all electricity bought or made.
Who benefits from this dashboard?
- Energy Manager: Owns the weather model, the Portfolio Manager account and the peak plan, and reads weather-normalized EUI before anything else each month.
- Chief Building Engineers: For them, peak demand and meters reporting are summer's daily numbers. A dead gateway in June costs more than one in March.
- Asset Managers: Energy cost per square foot and the ENERGY STAR score go straight into hold-or-sell discussions and leasing pitches, so they want both by building, not just for the portfolio.
- Finance: Budget variance tells them in July whether the summer will blow the operating budget, instead of finding out from September's bills.
- Property Managers: When the peak plan pre-cools a building at 5am or eases setpoints at 4pm, they're the ones answering the tenant calls, so they need to see why.
Check meters reporting before you celebrate a drop in consumption. A meter that stops sending data usually reads as zero, so a month with twenty meters offline can look like your best month of the year. Flag any month below 95% and don't compare it with anything.
Dashboard Example Overview
The owner runs twelve multi-tenant office buildings, 2.4 million square feet in all, across Atlanta, Charlotte and Nashville. There's one energy manager, a chief engineer at each building and 148 electric and gas meters. It tracks twelve KPIs monthly:
- Site Energy Use Intensity: Trailing 12 months of site energy in kBtu divided by gross floor area. EPA defines EUI as a year of energy over gross floor area, so a single month on its own means little.
- Weather-Normalized Site EUI: The same 12 months, re-modeled at normal cooling and heating degree days. The efficiency number, with the weather taken out.
- Energy Savings vs Baseline: How far weather-normalized EUI has fallen below the baseline year, the 12 months to September 2024, as a percentage. DOE's 50001 Ready guidance says that when weather drives consumption, absolute energy use can't be the performance indicator, and ISO 50001 asks for improvement shown against a baseline. This is that number.
- Portfolio Peak Demand: Each building's highest billed 15-minute demand in the month, in kW, summed. The number that sets the demand charge.
- Portfolio Load Factor: Electricity used divided by peak demand times the hours in the month. It rises when the same work gets done with a flatter load.
- Blended Electricity Cost per kWh: The whole electricity bill, energy and demand charges together, divided by kWh. Comparing it with the tariff's energy rate shows what the peaks cost.
- Energy Cost per Square Foot: Trailing 12 months of electricity and gas spend divided by gross floor area.
- Energy Budget Variance: Actual energy cost against budget for the month. Positive means over budget.
- Average ENERGY STAR Score: The mean of the twelve buildings' 1 to 100 scores in Portfolio Manager. EPA bases it on source energy and adjusts for weather and use.
- Energy Meters Reporting: Meters with a complete month of data divided by the 148 installed.
- Portfolio Renewable Electricity Share: On-site solar plus utility green tariff kWh, divided by total electricity.
- Portfolio Cooling Degree Days: Floor-area-weighted cooling degree days, base 65°F, across the three cities. No target. It's there so nobody argues about the weather.
This story is about two summers, and what changed in the eight months between them.
The first year opens unremarkably. In October 2024 the trailing site EUI is 57.5 kBtu per square foot, above EPA's 52.9 median for offices, and the average ENERGY STAR score is 62. Meters reporting sits around 90.5%, which everyone had gotten used to.
Summer 2025 is where it goes wrong. The FY2025 budget was last year's bills plus 2.5%, and the summer before had been mild. June brings 392 cooling degree days, and peak demand passes 10,000 kW for the first time, at 10,030. July peaks at 10,740 kW. Budget variance runs at 7.8% over in June, 9.0% in July and 8.6% in August. Meanwhile meters reporting has slid to 83.8% in July: 24 of 148 meters, most of them on old cellular gateways in two Atlanta buildings, aren't sending anything. The engineers find out about July's peak from the bill.
So the planning for summer 2026 starts in October 2025, and it changes five things. First, every failed gateway is replaced, and meters reporting climbs from 86.5% in October to 95.9% in December and 98.6% in January. Second, the four worst-scoring buildings get retro-commissioning over the winter: chilled water reset, corrected schedules and economizers that actually open. Third, the FY2026 budget is built from the weather model at normal degree days and the new tariff, with a 5% heat reserve added to June through September. Fourth, a written peak plan goes live in May: pre-cooling from 5am, staggered chiller starts and a demand limit on the hottest afternoons. Fifth, three more buildings move to the utility's green tariff in January and two parking deck roofs get solar in April, taking renewable share from 3.5% to 12.1%.
Then summer 2026 turns out hotter than summer 2025. Portfolio cooling degree days for June to September are 1,753, against 1,626 the year before. July hits 510 and August 505, against 466 and 465.
The buildings use less anyway. Energy savings against the baseline year sat between zero and -0.3% all through summer 2025. It reaches 3.4% in June 2026 and 5.5% in August. The highest peak of the summer is 9,760 kW in August, 980 kW below July 2025, and load factor in August rises from 57.6% to 59.8%, because pre-cooling moved load into the morning instead of piling it onto the afternoon. Budget variance is 0.4% under in June and 1.1% over in July.
Some of it doesn't land. August 2026 still runs 4.3% over budget, because the record heat beat the reserve. Blended electricity cost per kWh is $0.1160 in August against $0.1128 the year before, up despite the lower peak, because the utility's rates went up 4% in January. Energy cost per square foot falls only from $1.74 to $1.70. Renewable share slips to 10.1% in August, since the solar output can't keep pace with cooling load.
The yearly numbers are moving, just not far enough yet. Weather-normalized EUI drops from 58.3 in September 2025 to 54.4 in September 2026, which takes energy savings against the baseline from -0.3% to 6.4%, and the average ENERGY STAR score rises from 62 to 71. None of the three reaches its target: 52.9, 9% and 75. The trailing year still includes last autumn, when the retro-commissioning had barely started, so a cleaner read comes in early 2027. Actual site EUI is 56.2, and the gap of almost two points to the normalized figure is the hottest summer on record.
Creating an Energy Management Dashboard in SimpleKPI
-
Step 1 Settle floor area and meter mapping before any EUI
Gross square feet or rentable? Does the parking deck count? Which tenant submeters roll up into which building, and which meter feeds the shared chiller plant? EUI and cost per square foot are only as good as the denominator, and Portfolio Manager wants gross floor area. Write the meter map down and keep it current.
If you're still choosing which KPIs earn a place, the KPI selection guide walks through it.
-
Step 2 Fix the weather station and baseline year per building
Pick one weather station for each building, one base temperature and one baseline period, and don't change them to make a year look better. Energy savings vs baseline is only worth reading if the baseline stays put. The energy manager owns the model. Refit it after a major retrofit or a big swing in occupancy, and note the date on the board so nobody compares across the break.
-
Step 3 Give the engineers a summer view and finance a budget view
From May to September, chief engineers want peak demand and meters reporting by building every day, with the weather forecast beside them. The energy manager wants the monthly board. Finance and asset managers want budget variance, cost per square foot and the ENERGY STAR score each quarter, against the same quarter last year.
-
Step 4 Agree in advance what the peak plan may cost in comfort
Demand limiting works by letting space temperatures drift a degree or two on the worst afternoons. Agree with property managers which buildings, how many degrees and for how long, before July. Put tenant hot calls on the same review as peak demand, so a lower kW bought with angry tenants shows up for what it is.
List of Energy Management KPIs
Both EUI measures and the ENERGY STAR score have published EPA reference points; every other target here is this example's own starting point, to be replaced with your buildings' history.
| KPI Name | Typical Target | Description / Calculation |
|---|---|---|
| Site Energy Use Intensity | ≤ 52.9 kBtu/sq ft (ENERGY STAR US office median 52.9) | Trailing 12 months of site energy in kBtu divided by gross floor area. Lower is better. |
| Weather-Normalized Site EUI | ≤ 52.9 kBtu/sq ft (ENERGY STAR US office median 52.9) | Trailing 12 months of site energy modeled at normal degree days, divided by gross floor area. |
| Energy Savings vs Baseline | ≥ 9% (starting point) | Baseline-year weather-normalized EUI minus the trailing 12 months' figure, divided by the baseline. 9% would bring this portfolio to the 52.9 median. |
| Portfolio Peak Demand | ≤ 10,000 kW (starting point) | Sum of each building's highest billed 15-minute demand in the month. |
| Portfolio Load Factor | ≥ 50% (starting point) | kWh used divided by peak kW times hours in the month. |
| Blended Electricity Cost per kWh | ≤ $0.11 (starting point) | Total electricity bill, energy and demand charges, divided by kWh used. |
| Energy Cost per Square Foot | ≤ $1.60 a year (starting point) | Trailing 12 months of electricity and gas cost divided by gross floor area. |
| Energy Budget Variance | ≤ 2% over (starting point) | Actual energy cost divided by budgeted energy cost, minus one. Positive is over budget. |
| Average ENERGY STAR Score | ≥ 75 (EPA certification threshold) | Mean of the buildings' 1 to 100 scores in Portfolio Manager. 50 is the median. |
| Energy Meters Reporting | ≥ 98% (starting point) | Meters with a complete month of data divided by meters installed. |
| Portfolio Renewable Electricity Share | ≥ 10% (starting point) | On-site solar kWh plus green tariff kWh divided by total electricity kWh. |
| Portfolio Cooling Degree Days | No target | Floor-area-weighted cooling degree days, base 65°F. Context for every other row. |
Why Energy Management Dashboards Matter
Energy data in a building portfolio lives in three places that rarely meet. The utility bills sit with accounts payable, the interval data sits in the meter vendor's portal, and the ENERGY STAR scores sit in Portfolio Manager. Each one is right about its own slice, and none of them tells you in July that August will blow the budget.
These twelve also trade against each other in ways that only show up when they share a screen. Pre-cooling cuts peak demand but eats into energy savings, because the chillers start earlier and run longer. Moving buildings onto a green tariff lifts renewable share, and if that tariff carries a premium, it pushes up blended cost per kWh too. A retro-commissioning project can drop weather-normalized EUI for months while actual EUI goes up, because the summer was hotter. And a burst of missing meter data can make every consumption number look good at once.
So for a manager the rule is simple: never read consumption without degree days beside it, never read cost without peak demand, and never read anything in a month where meters reporting fell below 95%. For a portfolio with long cooling seasons, that's most of the job. If your board also has to cover emissions, waste and water, the environmental sustainability dashboard example picks up there, and the HVAC dashboard example shows the contractor side of the same summers.
The practical test comes every spring. Pull last summer's highest-peak afternoon for each building, the date, the hour and the temperature outside, and ask each chief engineer what they'll do differently on that afternoon this year. If the answer is a plan with a setpoint and a start time, the dashboard is doing its job.
Building it in SimpleKPI
Build this dashboard yourself with SimpleKPI's KPI dashboards. The mechanics are the same whatever you track:
- KPIs: each one gets a target, an entry frequency and tags, so you can report by team, site, product or whatever you split the numbers by.
- Data: type numbers in, import a spreadsheet, or use an integration or the API. The dashboard updates as each number lands, so daily and monthly KPIs sit side by side.
- Reports: scheduled KPI reports email the numbers to people who never log in.
- AI: Kip, the built-in AI, suggests targets and flags indicative benchmarks (AI estimates, not peer data) once some history builds up.
- Price: $79 a month for unlimited users and KPIs, as one flat price, with a 14-day free trial and no card needed.