What is an Eco Farm Startup Dashboard?
An eco farm startup dashboard is a visual display that brings a sustainable farm's key numbers, such as crop yield, water efficiency, soil health and profit margin, together on one screen. It shows production, sustainability and money side by side, so anyone can see whether the farm is growing well, farming responsibly and covering its costs. Founders use it to run the operation week to week. Investors, certifiers and grant bodies use it as evidence that the claims hold up.
Overview
An eco farm startup runs two businesses at once. One grows food. The other has to prove, season after season, that the growing is sustainable and the books balance. The numbers for both tend to live in different places: yield in a field notebook, water in meter readings, costs in a spreadsheet, certification paperwork in a drawer. A dashboard puts them in one view, and the trade-offs become visible. When water efficiency improves but yield slips, you see both lines move and can decide whether the trade was worth it.
Most eco farm dashboards cover three broad areas:
- Production covers crop yield, soil health and pest incidence, the agronomic core of the operation.
- Sustainability is water efficiency, carbon reduction and organic compliance. These are the numbers behind the "eco" in the name.
- Business takes in revenue and labor cost per crop, margin, market share and distribution, because a farm that loses money is not sustainable in any sense.
The example on this page covers all three, which suits a small team that has to answer for everything at once.
Who benefits from this dashboard?
- Founders and farm owners: yield, margin and sustainability in one view, which is most of what an investor update or grant report needs.
- Farm managers: watch pest incidence, labor cost and distribution week to week and act while the crop is still in the ground.
- Sustainability consultants: a clean record of water, carbon and compliance figures to work from, instead of reconstructing the year from receipts.
- Certifiers and grant bodies: not daily users, but the audience for much of the data. A dashboard makes reporting to them far less painful.
Dashboard Example Overview
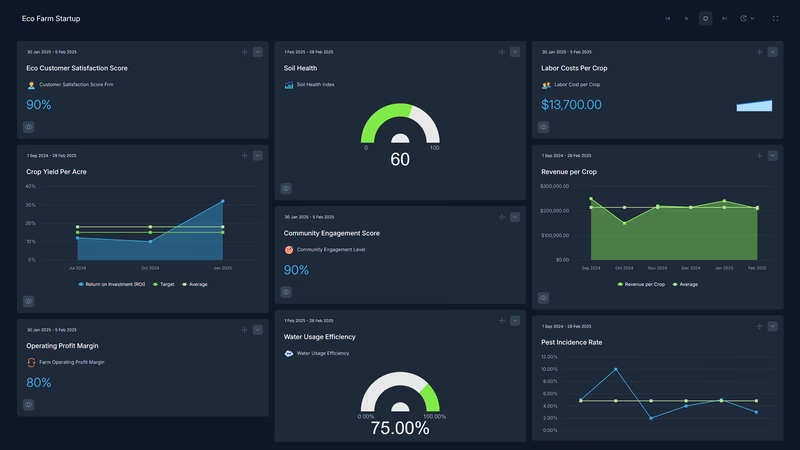
The dashboard pictured here tracks thirteen KPIs for a young sustainable farm, grouped around four questions:
- Are the fields producing? Crop Yield per Acre gives the headline harvest, while Soil Health Index and Pest and Disease Incidence Rate show whether that yield comes at the land's expense.
- Is the farming actually sustainable? Water Usage Efficiency, Carbon Footprint Reduction and Organic Certification Compliance carry the environmental case in numbers rather than adjectives.
- Does the business hold up? Revenue per Crop, Labor Cost per Crop and Farm Operating Profit Margin show which crops earn their space and whether the whole operation clears a margin.
- Is anyone buying? Customer Satisfaction Score, Market Share Growth, Distribution Efficiency Rate and Community Engagement Level track demand, delivery and the local goodwill an eco farm trades on.
None of this needs expensive sensors. Yield, water and labor figures come from records most farms already keep. The dashboard just puts them where the trade-offs can be seen.
Keep Water Usage Efficiency and Crop Yield per Acre on the same view. An efficiency gain that quietly costs you yield is not a gain, and the pair keeps each other honest.
Creating an Eco Farm Startup Dashboard in SimpleKPI
-
Step 1 Decide what "sustainable and solvent" means in numbers
Write down the handful of measures that prove the farm is working: yield, water, soil, margin, compliance. Give each a definition you could defend to a certifier. This guide to writing SMART KPIs helps turn vague goals into measurable ones.
-
Step 2 Add your farm KPIs
Create each KPI in SimpleKPI with a target and a frequency that matches the farm: weekly for operations, seasonal for yield and soil. Tags keep crops, fields and sales channels separate. Plans include unlimited KPIs, so nothing gets cut to fit a quota.
-
Step 3 Connect your data
Feed numbers in through spreadsheet imports, integrations or the API. Meter readings and sales can land weekly, while soil tests and carbon estimates arrive a few times a year. The dashboard updates as each one does.
-
Step 4 Build views for different audiences
An operations view for the field team, a sustainability view for certifiers and grant applications, a margin view for investors. Same data, three different stories.
-
Step 5 Share, review, adjust
Review the board at the weekly farm meeting, and let scheduled KPI reports carry the numbers to backers who will never log in. Kip, the built-in AI, can suggest targets and offer indicative benchmarks (AI estimates, not peer data) as your seasons accumulate. Retire anything nobody acts on.
List of Eco Farm Startup KPIs
The table below covers every KPI on the example dashboard. Targets are general guidance. Farming varies too much by crop, climate and acreage for universal numbers, so treat your own baseline as the real benchmark.
| KPI Name | Typical Target | Description |
|---|---|---|
| Crop Yield per Acre | Set from your baseline | The produce harvested per acre of land. Compare crop to crop and season to season rather than against other farms. |
| Water Usage Efficiency | Improving season over season | Water used per unit of crop yield. The clearest single sustainability number a farm can show. |
| Labor Cost per Crop | Stable or falling per unit | The labor cost of growing each crop type. Hand-weeded organic rows are labor-hungry; this shows which crops repay the effort. |
| Revenue per Crop | Trending up | Revenue generated by each crop type. Read beside labor cost to find the crops that earn their acreage. |
| Customer Satisfaction Score | 85% or higher | Satisfaction with the produce sold. For a premium-priced product, this is the early warning on repeat sales. |
| Soil Health Index | Improving year over year | Soil quality tracked over time. Scores depend on the testing method, so a consistent method matters more than the number itself. |
| Pest and Disease Incidence Rate | Low and trending down | The frequency of pest and disease outbreaks. Without synthetic controls, catching a rise early is the whole game. |
| Farm Operating Profit Margin | Positive and improving | Profit as a percentage of operating revenue. The number that decides whether the mission continues. |
| Carbon Footprint Reduction | Steady year-over-year cuts | The annual reduction in emissions from farming practices. Estimate it consistently and watch the trend. |
| Market Share Growth | Trending up | The farm's share of its local market over time. Slow-moving, so a quarterly check is enough. |
| Distribution Efficiency Rate | 95% or higher | Orders delivered on time and in full. Fresh produce forgives no delays. |
| Community Engagement Level | Set from your baseline | Participation in farm events, volunteer days and box-scheme activity. Soft, but a useful early read on loyalty. |
| Organic Certification Compliance | 100% | Adherence to organic farming standards. Anything below full compliance is a problem to fix, not a target to shave. |
Why Eco Farm Startup Dashboards Matter
An eco farm startup is judged twice: once by the market, on price and quality, and once by its own mission, on water, soil and carbon. Plenty of farms manage one. The hard part is both at once, and a dashboard is the only practical way to watch the two scoreboards together.
The deeper value is in timing. Margin is a lagging number; by the time it disappoints, the season that caused it is over. Soil health, pest incidence and water efficiency move first, which makes them the levers you can still pull. A founder who watches the leading numbers gets to correct course in July instead of explaining the year in December.
There is also the matter of proof. Certification renewals, grant applications and investor updates all ask for the same evidence, and a farm that tracks these thirteen KPIs already has it on hand. Thirteen is also about the ceiling for a small team. If the list grows past what anyone acts on, there is a good case for tracking fewer KPIs, not more.
Build this dashboard yourself with SimpleKPI's KPI dashboards, and pay one flat price for unlimited users and KPIs.