What is a Film Production Dashboard?
A film production dashboard is a visual display that brings a production company's key numbers, such as production cost per film, filming days, revenue and audience ratings, together on one screen. It shows each project, and the slate as a whole, against target in charts and gauges anyone can read without a finance briefing. Producers use it to keep budgets and schedules honest while the cameras are rolling. Executives and financiers use it to judge whether the slate is earning its keep.
Overview
Film production runs on creativity, but it is financed on numbers, and those numbers tend to live in different places: budgets with the accountant, schedules in the production office, ratings and engagement scattered across platforms. A dashboard puts them side by side, and the connections start to show. A shoot that drifts two days over schedule turns up later as a cost overrun. A strong social campaign turns up later in revenue per film.
The numbers on a film production dashboard fall into three groups:
- Production health: cost per film, filming days and the percentage of projects on schedule, the numbers you can still act on while a film is being made.
- Commercial results: revenue, ROI, market share and release count. They arrive late, but they settle every argument.
- Reception: audience ratings, critical acclaim and social engagement, which shape how the next project gets financed and sold.
The example on this page carries all three, which suits a production company that wants one place to watch the whole operation.
Who benefits from this dashboard?
- Producers: production cost, ROI and schedule status in one view, which is most of what a financing conversation needs.
- Line producers and production managers: filming days and on-schedule percentage, tracked daily, so a slipping shoot is caught in days rather than discovered in the wrap report.
- Directors: audience ratings and critical acclaim across past work, useful context when arguing for creative choices on the next one.
- Marketing and distribution teams: social engagement per campaign and distribution deals closed, the two numbers that describe how wide a film will land.
Dashboard Example Overview
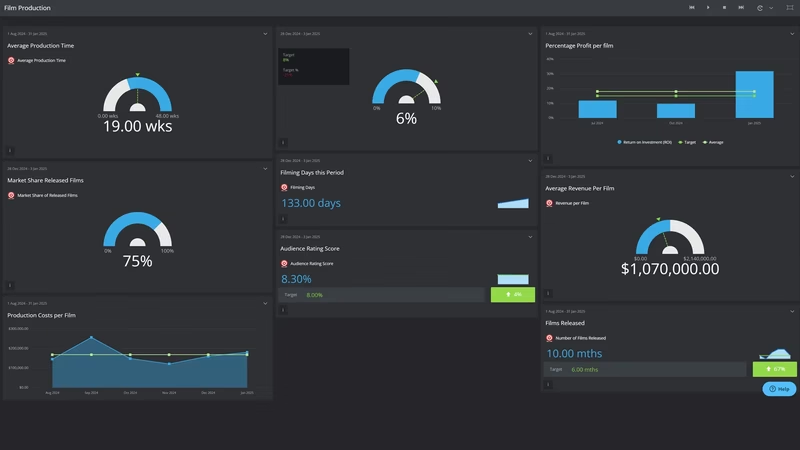
The dashboard pictured here tracks eleven KPIs, grouped around four questions:
- Are we on budget and on schedule? Production Cost per Film, Filming Days and Percentage of Projects on Schedule cover the making. Between them they catch most overruns while there is still time to respond.
- Is the work paying back? Revenue per Film, Return on Investment (ROI) and Number of Films Released give the commercial scoreboard for the slate.
- How are the films landing? Audience Rating Score, Critical Acclaim Score and Social Media Engagement measure reception with viewers, critics and the campaign audience.
- Are we winning the market? Market Share of Released Films and Distribution Deals Closed show whether the company's position is growing or shrinking.
None of this requires new record keeping. Budgets, call sheets, production reports, platform analytics and sales agreements already hold every figure here; the dashboard just puts them in the same room.
Put Filming Days, Percentage of Projects on Schedule and Production Cost per Film on the same view. Schedule slip shows up in days before it shows up in dollars, and days are cheaper to fix.
Creating a Film Production Dashboard in SimpleKPI
-
Step 1 Map your production pipeline
Write down the stages a project passes through, from development and pre-production through the shoot, post and release, and pick the measure that matters at each one. Cost and days rule during production; ratings and revenue take over after release.
-
Step 2 Add your film production KPIs
Create each KPI in SimpleKPI with its target and frequency. Tags keep things organized by project, genre or label, which matters once several productions run at once. Plans include unlimited KPIs, so a growing slate doesn't force choices.
-
Step 3 Connect your data
Feed numbers in through spreadsheet imports, integrations or the API. During a shoot, filming days and schedule status come straight off the daily production report; revenue, ratings and market figures land weekly or monthly after release.
-
Step 4 Build views for different audiences
A per-project view for the production office, a slate summary for executives and financiers, a campaign view for marketing. Same data, different framing. If the marketing view needs sharper engagement measures, this guide to social media KPIs covers the options.
-
Step 5 Share, review, adjust
Put the dashboard on a screen in the production office, bring it to slate reviews, and let scheduled KPI reports carry the numbers to financiers who won't log in. Kip, the built-in AI, can suggest targets and flag indicative benchmarks (AI estimates, not peer data) as your history builds. Retire any KPI nobody acts on.
List of Film Production KPIs
The table below covers every KPI on the example dashboard. Targets are general guidance; film economics vary so widely by budget tier and distribution model that your own baseline beats any generic range.
| KPI Name | Typical Target | Description |
|---|---|---|
| Production Cost per Film | Within approved budget | The total cost to produce a single film. Read against each project's approved budget, not against the slate average. |
| Filming Days | On plan per project | Days spent shooting. Every day over plan carries crew, equipment and location costs with it. |
| Revenue per Film | Set from your baseline | Average revenue per released film across all windows: theatrical, streaming, broadcast and beyond. |
| Audience Rating Score | Trending up | Average audience score across the platforms you track. The clearest signal of whether films are landing with viewers. |
| Return on Investment (ROI) | Positive and improving | Profit as a percentage of production investment, per film and across the slate. |
| Market Share of Released Films | Stable or growing | Your releases' share of the market you compete in. A position measure rather than a project one. |
| Number of Films Released | Set against your slate plan | Releases in the period. Output matters; a slate that ships nothing has no other KPIs to discuss. |
| Critical Acclaim Score | Trending up | Average critic score for released films. It shapes talent relationships, festival access and the next round of financing. |
| Social Media Engagement FP | Rising through each campaign | Average engagements per film campaign. A leading indicator for opening performance. |
| Distribution Deals Closed | Set per release plan | Deals signed for films in production or release. They determine how wide each film can actually go. |
| Percentage of Projects on Schedule | 80% or above | The share of projects hitting their timeline milestones. The earliest warning the dashboard offers. |
Why Film Production Dashboards Matter
Every production balances creative integrity against commercial viability, and the argument between the two is usually settled with numbers someone has to hunt for. A dashboard ends the hunting. Cost, schedule, reception and return sit on one screen, and slate meetings start from the same facts instead of competing spreadsheets.
Timing is the deeper reason. Revenue, ratings and market share are lagging numbers; by the time they disappoint, the film is finished and the money is spent. Filming days and on-schedule percentage lead. They move while a production can still be steered, which makes them the most valuable numbers on the board even though they look the least glamorous. For a longer story about an entertainment giant that watched the wrong numbers, read how a KPI dashboard could have changed the Netflix and Blockbuster story.
The reception numbers earn their place between those two extremes. Audience ratings, critical acclaim and social engagement set the terms for the next project as much as they describe the last one, from financing conversations to distribution deals. Track them deliberately and you walk into those conversations already knowing what the other side of the table has looked up.
Build this dashboard yourself with SimpleKPI's KPI dashboards, and pay one flat price for unlimited users and KPIs.