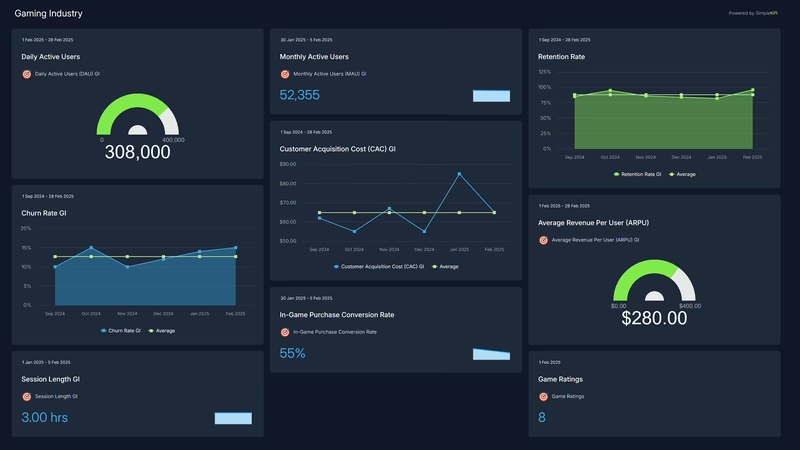
Gaming Performance Dashboard
The morning a big publisher's new RPG goes live in your sub-genre, nothing on your dashboard moves. The damage turns up over the following weeks. Installs cost more because two studios are now bidding for the same players. First-day retention sags. A few of your best spenders go to look at the new thing, and only some of them come back.
The market they're fighting over is big and barely growing. US consumers spent $60.7 billion on video games in 2025, up 1.4% on 2024, according to the Entertainment Software Association, Circana and Sensor Tower, and a March 2026 restatement put the final figure at $60.8 billion. Sensor Tower put mobile game spending at $26.7 billion, with mobile up about 1%. ESA's 2025 survey found 82% of players aged 8 and older play on a mobile device. In a flat market, a new player for you is usually a player someone else lost.
Keeping them is getting harder. GameAnalytics' 2026 benchmarks, built from more than 16,000 mobile games in 2025, found the median game kept about 22% of players to the day after install and roughly 0.7 to 0.8% to day 30, with retention still sliding from 2024. North American medians were a little better: 23.28% on day 1 and 1.18% on day 30.
We invented the studio in this example: a small US independent team running a free-to-play fantasy RPG on iOS and Android. Its monthly figures are modeled, not taken from a real game, and the rival release in the story is part of the scenario. Four of the twelve targets below lean on a published benchmark or a platform threshold. The rest are starting points.
What is a Gaming KPI Dashboard?
Overview
A gaming KPI dashboard shows whether the players you pay to acquire stay long enough, and spend enough, to cover what they cost, and whether the build is stable enough to keep them.
It starts with acquisition. Cost per install is what each paid player cost. Day-1 retention says whether the first session landed. Day-30 retention says whether the game has a second act.
Then habit. DAU counts who turned up on an average day. DAU/MAU stickiness shows how many days a month the month's players come back, and average session length shows how long they stay when they do. Monthly player churn counts last month's players who didn't return at all.
Then money. Payer conversion rate is the share of the month's players who bought anything. ARPU spreads the month's revenue across every active player, paying or not. Player LTV projects what a new install will spend in its first year, and it's the figure to hold against CPI.
Last, the build and the store page. User-perceived crash rate is the share of daily players who hit a crash. Average store rating is what this month's reviewers think, and it's often where a bad update shows first.
Who benefits from this dashboard?
- Studio Head: LTV against CPI decides the marketing budget. DAU against the same month last year says whether the game is growing or just running a good event.
- Live-Ops Producer: Did the last season give players a reason to come back, or a reason to log in once? Stickiness, session length and churn answer that within a few weeks.
- User Acquisition Lead: CPI and day-1 retention, split by channel. A cheap install that's gone by the weekend wasn't cheap.
- Engineering and QA Lead: The crash rate belongs to them. Above Google Play's threshold it costs store visibility as well as reviews.
- Monetization Designer: Payer conversion and ARPU often move apart. A new offer that lifts one and drops the other shows up here before it shows up in the bank account.
Split day-1 retention by install source before you blame the tutorial. Players bought through broad paid campaigns usually come back less than players who found the game in the store, so a month heavy on paid installs drags the blended figure down even when nothing in the game changed.
Dashboard Example Overview
The studio has 24 people in Raleigh, North Carolina, and one live game: a free-to-play fantasy RPG on iOS and Android, launched in 2023, that earns its money from in-app purchases of cosmetics, a season pass and hero upgrades. Between 345,000 and 456,000 people play it in a month, most of them in the US. It reports monthly against twelve KPIs:
- Cost Per Install (CPI): Paid acquisition spend divided by the installs attributed to it. Organic installs stay out, or the figure flatters the ad budget.
- Day-1 Retention: Players who open the game the day after installing, divided by players who installed. The monthly figure averages that month's daily cohorts.
- Day-30 Retention: The same calculation on day 30. For an RPG, this is the group that buys season passes.
- Daily Active Users (DAU): Unique players who opened the game each day, averaged across the month.
- DAU/MAU Stickiness: Average DAU divided by unique players active in the month. At 18%, the typical monthly player shows up on five or six days.
- Average Session Length: Total foreground play time divided by sessions, in minutes. RPG sessions run several times the mobile median, so judge it against your own history.
- Monthly Player Churn Rate: Players active last month who didn't open the game this month, divided by last month's active players.
- Payer Conversion Rate: Unique players who made at least one purchase in the month, divided by monthly active players.
- Average Revenue Per User (ARPU): Gross in-app purchase revenue divided by monthly active players. It equals payer conversion times average revenue per paying user, which is how you tell fewer buyers from smaller baskets.
- Player Lifetime Value (LTV): Predicted gross revenue per install over its first 365 days, from a cohort model re-run each month.
- User-Perceived Crash Rate: Share of daily active users who had at least one crash while actively playing, the definition Google Play uses in Android vitals. The studio applies the same rule to iOS.
- Average Store Rating: The average stars on new ratings received that month across both stores. Not the lifetime summary, which barely moves and which Apple lets developers reset with a new version.
For the first nine months the game grows. DAU rises from 69,706 in October 2024 to 86,181 in June 2025, with a winter event in December pushing payer conversion to 3.04% and ARPU to $1.58. Day-1 retention holds around 32%, day-30 between 3.8 and 4.5%, and installs cost $2.90 to $3.45. In June, predicted LTV of $4.28 against a $3.15 CPI means each paid player is worth about 1.36 times what it cost.
In mid-July 2025 a large publisher launches a free-to-play RPG in the same sub-genre, backed by a launch ad budget this studio can't match. Nothing changes inside the studio's own game. The board changes anyway.
CPI goes first: $4.20 in July and $4.85 in August, because both games are now bidding for the same players in the same ad auctions. Day-1 retention falls to 27.6% in August as curious players install both and keep one. Monthly churn reaches 46.8%. Then the spenders go. Payer conversion slides from 2.64% in June to 2.02% in August, and ARPU from $1.26 to $0.88. By September DAU is 57,516, a third below June, and predicted LTV of $3.26 sits under a $4.70 CPI. Every paid install is losing money.
In October the studio stops chasing. It cuts paid acquisition spend roughly in half, keeps buying only in the narrow audiences where its installs still retain, and starts rebuilding the first hour of the game around the class-choice screen where most new players were quitting. Day-1 retention edges up to 29.0%, partly because fewer paid installs means fewer players who were never going to stay.
Then it makes things worse for a month. A guild co-op update, pulled forward to land before the holidays, ships in November after too little testing on older Android phones. User-perceived crash rate jumps from 0.74% to 1.31%, past the 1.09% line where Google Play says an app is likely to become less discoverable. New ratings that month average 3.92 stars. Two hotfixes bring the crash rate to 0.88% in December and 0.61% in January.
The winter event still works, just smaller. December 2025 conversion is 2.71% and ARPU $1.35, against 3.04% and $1.58 a year earlier, with about 74,000 fewer players in the month.
The new first hour ships in January 2026, and day-1 retention reaches 33.4%, then 34.6% by September, higher than before the rival arrived. Some of that is the better opening and some is the mix, since paid installs are now a smaller share of new players. Day-30 retention climbs back to 4.4% and churn falls to 39.5%. ARPU reaches $1.30 and LTV $4.58, both above June 2025. New ratings average 4.62 stars and the crash rate is down to 0.48%.
CPI never comes back. It's $4.05 in September 2026, against $3.15 before the launch. The rival is still buying the same players, and a publisher with a catalog to cross-sell into can pay more for each one than a single-game studio can. So the studio buys fewer: LTV is 1.13 times CPI, down from 1.36, which supports a smaller budget, not the old one. Even with fewer paid installs coming in, DAU recovers to 77,502, about 90% of the June 2025 peak. The studio now plans around that figure instead of waiting for the old one.
Creating a Gaming Dashboard in SimpleKPI
-
Step 1 Pin down what counts as a returning player
Is day 1 the next calendar day or 24 to 48 hours after install? Does a reinstall count as a new player? Does someone on a phone and a tablet count once or twice? When does a session end if the game sits in the background? Two analytics tools can report day-1 retention several points apart for the same game, and both can be right by their own rules. Write your answers down before you set a single target.
The KPI selection guide covers how to cut a long list of game metrics down to the few worth a target.
-
Step 2 Name the source for installs, players, revenue and crashes
CPI comes from your attribution partner, retention, DAU, sessions and churn from the analytics SDK, revenue from the App Store and Google Play consoles, and crashes from Android vitals plus your own crash reporting on iOS. Pick gross or net of store fees once, and use the same choice for ARPU and LTV, or the comparison with CPI is off by the store's cut.
-
Step 3 Hold LTV against CPI before every budget change
LTV is a forecast, so re-run the cohort model each month and compare it with CPI channel by channel, not blended. When a channel's ratio drops below 1, cut it before the next month's invoice, not after the cohort finally proves it. Read it alongside day-1 retention, since new cohorts that retain worse will pull next month's LTV down too.
-
Step 4 Gate every update on the crash rate, not the live-ops calendar
Release through a staged rollout and hold it if the user-perceived crash rate on the new build climbs toward 1.09% overall, or toward 8% on any single device model. An event that starts a week late costs less than a month of one-star reviews and a store that shows you to fewer people.
List of Gaming KPIs
Day-1 retention, day-30 retention and session length have published GameAnalytics medians to compare with, and crash rate has Google Play's threshold. Every target marked (starting point) is this example's own, to replace once you have a year of your game's history.
| KPI Name | Typical Target | Description / Calculation |
|---|---|---|
| Cost Per Install (CPI) | ≤ $3.50 (starting point) | Paid acquisition spend divided by paid installs attributed to it. Lower is better. |
| Day-1 Retention | ≥ 33% (GameAnalytics 2025 North America mobile median 23.28%) | Players who open the game the day after install divided by players who installed. |
| Day-30 Retention | ≥ 4% (GameAnalytics 2025 North America mobile median 1.18%, top 10% 4.78%) | Players who open the game on day 30 after install divided by players who installed. |
| Daily Active Users (DAU) | ≥ 75,000 (starting point) | Unique players who opened the game each day, averaged over the month. |
| DAU/MAU Stickiness | ≥ 18% (starting point) | Average daily active users divided by unique players active in the month. |
| Average Session Length | ≥ 13 minutes (GameAnalytics 2025 North America mobile median 3.64, top 10% 8.50) | Total foreground play time divided by number of sessions. RPGs run well above the all-genre figures. |
| Monthly Player Churn Rate | ≤ 40% (starting point) | Players active last month who did not play this month divided by last month's active players. Lower is better. |
| Payer Conversion Rate | ≥ 2.5% (starting point) | Unique players with at least one purchase in the month divided by monthly active players. |
| Average Revenue Per User (ARPU) | ≥ $1.20 a month (starting point) | Gross in-app purchase revenue for the month divided by monthly active players. |
| Player Lifetime Value (LTV) | ≥ $4.50 (starting point) | Predicted gross revenue per install over its first 365 days, from a monthly cohort model. Compare with CPI. |
| User-Perceived Crash Rate | ≤ 0.8% (Google Play bad behavior threshold 1.09%) | Daily active users who had at least one crash while actively playing divided by daily active users. Lower is better. |
| Average Store Rating | ≥ 4.5 stars (starting point) | Average stars on new ratings received in the month across the App Store and Google Play. |
Why Gaming Dashboards Matter
Most of the numbers a game studio watches can be pushed up by quietly pushing another one down, and in a live game the cost usually lands a month later.
A hard-sell starter pack lifts payer conversion this month and churn next month. A bigger ad budget fills DAU while dragging down day-1 retention, because the extra installs come from players who were never much interested. A long session can mean a player who loves the game, or one stuck grinding against a wall they're about to quit at. And the live-ops calendar pulls against the crash rate every time an event is promised for a date the build isn't ready for, which is how this studio's November went.
One at a time, each of those looks like a good month. Read against LTV and CPI on the same board, you can see whether the game earned more from its players or just spent more getting them.
When a big release lands in your genre, check CPI and payer conversion every week for the next two months. They move first, and between them they tell you whether to fight for the same players or spend less and keep the ones you already have.
Building it in SimpleKPI
Build this dashboard yourself with SimpleKPI's KPI dashboards. The mechanics are the same whatever you track:
- KPIs: each one gets a target, an entry frequency and tags, so you can report by team, site, product or whatever you split the numbers by.
- Data: type numbers in, import a spreadsheet, or use an integration or the API. The dashboard updates as each number lands, so daily and monthly KPIs sit side by side.
- Reports: scheduled KPI reports email the numbers to people who never log in.
- AI: Kip, the built-in AI, suggests targets and flags indicative benchmarks (AI estimates, not peer data) once some history builds up.
- Price: $79 a month for unlimited users and KPIs, as one flat price, with a 14-day free trial and no card needed.