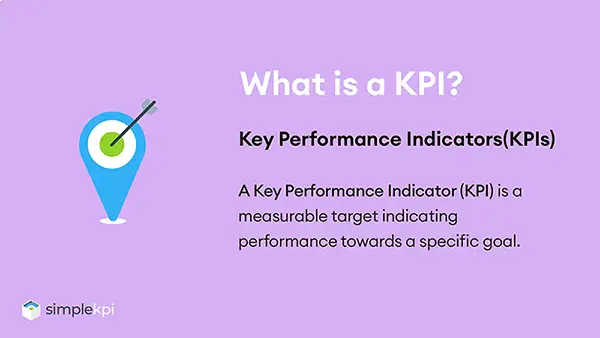
What is a KPI?
Key Performance Indicators (KPIs) are a type of measure used to evaluate an organization's performance against its strategic objectives. KPIs help to cut the complexity associated with performance tracking by reducing a large amount of measures into a practical number of 'key' indicators.
KPIs are essential for monitoring the performance of companies, departments, or individuals in relation to specific targets or goals. They are a reliable measurement tool, aiding decision-making and offering valuable insights into efficiency and productivity.
Key Performance Indicators vary based on performance criteria, industry, and company goals. They allow organizations to assess progress succinctly and make informed strategic decisions.
Learn more about KPIs:
The difference between KPIs and Metrics
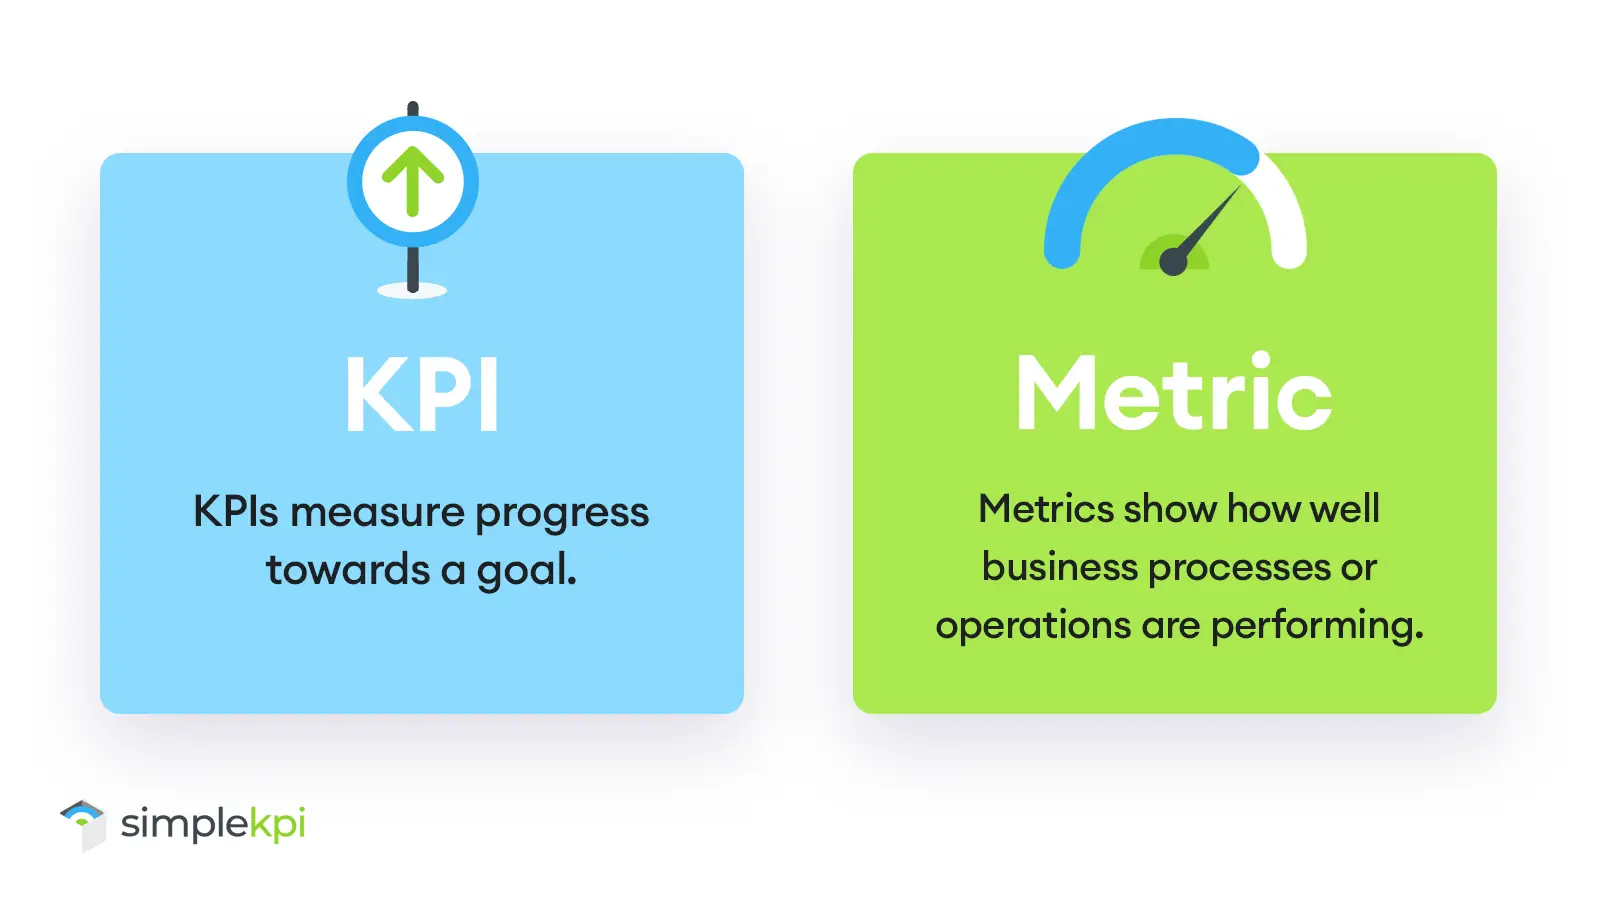
You will often hear KPIs and Metrics used in the same sentence when discussing performance tracking, and although it is said that one person's KPI is another person's metric, they do serve very different and specific purposes.
KPIs
KPIs measure the progress towards a goal, and metrics provide the data to support decisions and improvements.
For example, a KPI could be to increase sales by 10% in a quarter or to increase customer satisfaction by 20%. These KPIs use such raw metrics in calculations to generate the result.
When KPIs are created to achieve a specific goal, they typically follow a structure such as SMART (specific, measurable, achievable, relevant, and time-bound). This provides a clear understanding of what goal the KPIs are trying to achieve and how it's performing against that goal.
Metrics
Metrics, on the other hand, are simply measurements of something. For example, a metric could be the number of customers or website visitors.
They are measures that use data generated as part of the ordinary course of running a business - providing feedback on a business action or process. Metrics will focus on targets rather than goals.
The benefits of using KPIs
Companies choose to track KPIs for various strategic reasons. These can include shifting company focus, trying to become more efficient, managing performance, and even a complete change in direction.
The 4 Main Benefits of tracking KPIs are:
- They provide clarity and focus by defining and communicating an organization or department's vision, mission, and objectives. They also help align different teams' and individuals' activities and efforts with the overall strategy and direction.
- An easier way to track the performance of an organization or department. KPIs help identify strengths, weaknesses, opportunities, threats, and areas for improvement or recognition
- They help decision-making by providing insights and evidence to support decisions that are based on real data.
- They foster a culture of accountability leading to productivity improvements across the company. This sense of responsibility and ownership among the employees and managers can encourage a culture of learning and innovation, where feedback and suggestions are welcomed and implemented.
Common types of KPIs
Across different business functions, KPIs have a wide range of practical applications, from daily indicators that provide real-time management information to more long-term organizational objectives.
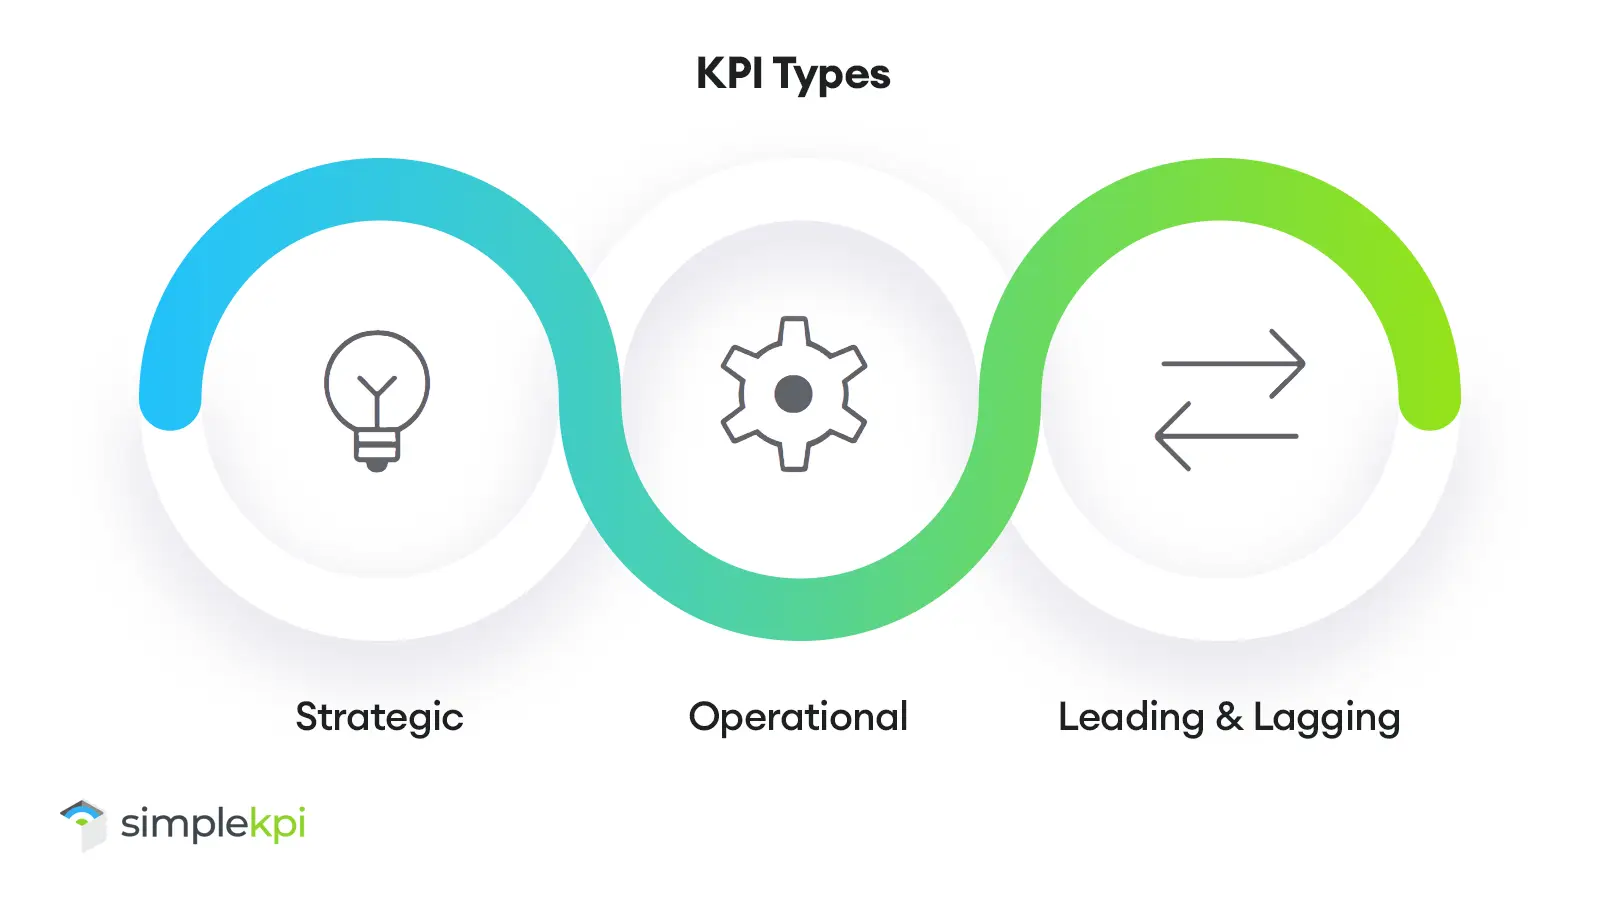
Typically, KPIs fall into two main categories:
Operational KPIs
Operational KPIs clearly articulate detailed and timely information used to make daily decisions or take corrective actions on performance or a process. These KPIs can range from simple to complex, using formulas with data from multiple sources.
Some examples of Operational KPIs would be:
- Accounts Receivables Turnover measures how efficiently a company collects on its receivables.
- Days Sales Outstanding (DSO) tracks the average time clients pay after purchasing.
- Operating Cash Flow reflects the cash generated from day-to-day company operations.
Strategic KPIs
Strategic KPIs are focused on long-term objectives derived from an organization's goals. They help identify if a strategy is working and if it is on target. As such, these KPIs are sometimes referred to as High-Level KPIs.
Some examples of Strategic KPIs would be:
- Production lead time focuses on streamlining the time it takes to move a product from raw material acquisition to finished goods delivery.
- Overall equipment effectiveness (OEE) measures the efficiency of manufacturing equipment. It considers availability (uptime), performance (speed), and quality (defects).
- Defect Rate monitors the percentage of defective products produced. By aiming for an 8% reduction in defects, the organization strives to enhance product quality, minimize rework, and boost customer satisfaction.
What are Leading and Lagging KPIs
In addition to operational and strategic KPIs, you will often hear the terms “leading” or “lagging” indicators mentioned; these represent how KPIs are used to either confirm long-term trends or provide signals on future performance.
Leading KPIs
Leading KPIs predict or influence future performance. They are more challenging to set up as they rely more on external actions to impact outcomes, such as process changes or infrastructure investments. For example, increasing the number of 'routine maintenance checks' in a production line may highlight faults causing defects. This would then lead to a higher overall unit production rate.
Lagging KPIs
Lagging KPIs determine the result of past performance, such as production, volume, or a result. They are easy to measure as they are typically a simple value used to understand how well a process performs. For example, the 'number of units produced' in a manufacturing process or 'revenue this month' are lagging KPIs.
Remember, leading KPIs inform future actions while lagging KPIs validate past outcomes.
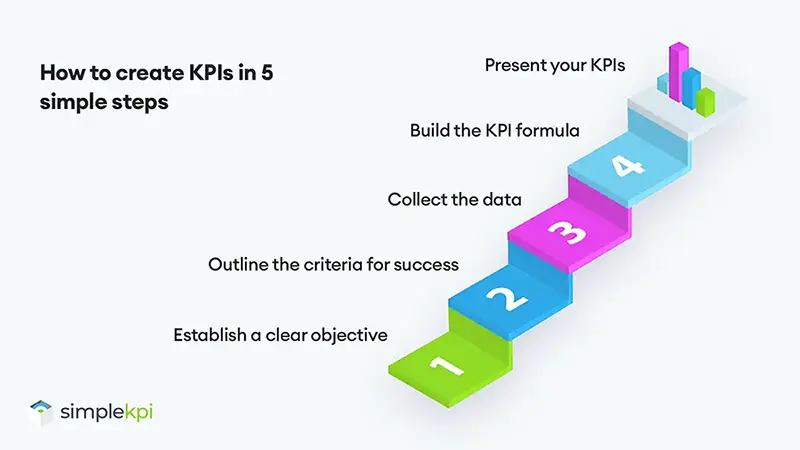
How to create KPIs in 5 simple steps
Developing meaningful KPIs that track and clearly visualize performance takes some planning. Each KPI must address a business objective and provide timely, accurate information to assess progress toward goals.
Creating successful KPIs comes down to understanding the aspirations of the business using a transparent, structured process for crafting KPIs.
Here's how to create a KPI:
-
Establish a clear objective.
If the goal of the business is to be the 'market leader,' then a KPI objective may be to 'increase revenue by 10% this financial year' or 'Expand our product lines to 20'. State clearly, and in simple terms, the purpose of the KPI. This guides anyone viewing the KPI to interpret the data in the correct context. -
Outline the criteria for success.
What will the target be? Is it attainable? When should it be accomplished? And how will progress be monitored? Targets should be realistic, and changes to business processes take time to implement. In the initial stages of KPI monitoring, it's best to focus on long-term targets with midterm monitoring. -
Collect the data.
Investigate the availability and accuracy of the data. Data may be available automatically from existing systems or hidden in reports and databases. This data must all be pulled together regularly for reporting in one central place. -
Build the KPI formula.
Some KPIs contain but a single metric or measure. However, most rely on a combination brought together under a single calculated formula. For example, a KPI that measures productivity in revenue by machine would look like this: Total Revenue divided by the total number of machines. Build formulas and create calculations with test data to see if the results are what you would expect. -
Present your KPIs.
You will need to translate the data into understandable visuals, such as graphs and charts to communicate your KPIs efficiently. Either KPI Dashboards for Operational KPIs or KPI Reports for Strategic KPIs, both offer a convenient way to create, track, and distribute your KPIs.
Although setting up KPIs may seem time-consuming, following practical steps to develop your KPIs can streamline the process.
Using a KPI Generator to create your KPIs.
There are many tools, libraries, and templates available for KPI creation. With the advent of AI, it is now possible to leverage advanced technology to research and generate modern, industry-standard KPIs easily. You can then incorporate these KPIs into spreadsheets or your existing applications.
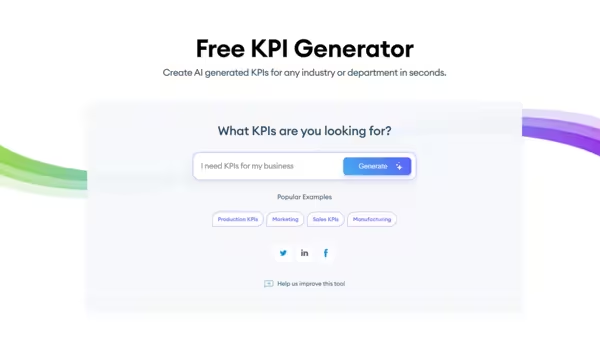
The benefits of using an AI-powered Generator are:
- Efficiency: Quickly generate KPIs tailored to your specific needs.
- Customization: Adapt the KPIs to match your business objectives and industry requirements.
- Guidance: Benefit from built-in best practices and expert recommendations.
Head over to our free KPI Generator tool to start generating your KPIs.
How to track KPIs
Effectively tracking Key Performance Indicators (KPIs) is essential for goal-oriented performance initiatives. However, two crucial factors require attention:
- Timing: Determine when to track KPIs based on decision-making urgency.
- Resource Allocation: Assess available resources for data reporting.
Some examples of KPI Reporting frequencies - and the types of KPIs that are tracked:
- Live (Continuously):
For real-time monitoring, especially in critical areas like website uptime, server performance, or financial transactions.Useful when immediate action is required based on KPI fluctuations. - Daily:
Common for operational KPIs, such as sales orders processed, customer inquiries handled, or website visits.Provides a snapshot of daily performance trends. - Weekly:
Balances granularity and practicality. Ideal for tracking KPIs related to marketing campaigns, employee productivity, or customer satisfaction. - Monthly:
Widely used for financial KPIs (e.g., revenue, profit, expenses). Allows time for data aggregation and analysis. - Quarterly:
Suitable for strategic KPIs, organizational health, and long-term trends. Aligns with quarterly business reviews and planning cycles. - Biannually or Annually:
Reserved for high-level KPIs, such as overall company growth, market share, or employee retention.
Presenting KPIs
When it comes to Key Performance Indicators, Presentation Is Everything. Even the best planning, knowledge and methodology can render your hard efforts obsolete if the KPIs fail to communicate effectively.
Luckily, there are a couple of tried and tested solutions that will help you measure and report on your KPIs:
KPI Dashboards
KPI Dashboards are highly flexible communication tools that allow you to convert data into graphs and charts quickly. They are orientated towards presenting real-time operational KPIs that should be seen at a glance, such as 'Number of sales this month' or KPIs associated with Marketing Campaigns.
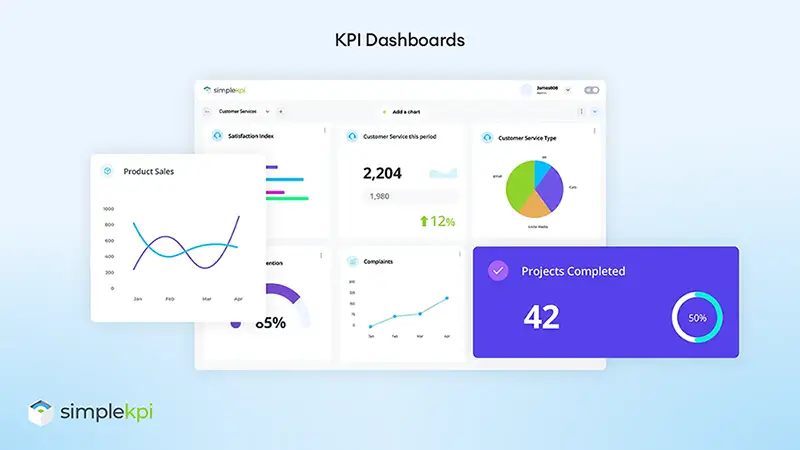
Most dashboards incorporate sharing functionality so they can be conveniently distributed among the team's departments and users.
Dashboards can be created with dedicated KPI Software, spreadsheets, tracking built into existing applications, and dedicated business dashboard applications.
KPI Reports
KPI Reports offer an in-depth, analytically focused platform for presenting KPIs. They typically incorporate drill-down and analytics features to interrogate the trend data behind the KPIs. This makes reports a good fit for long-term strategically focused objectives such as increasing market share.
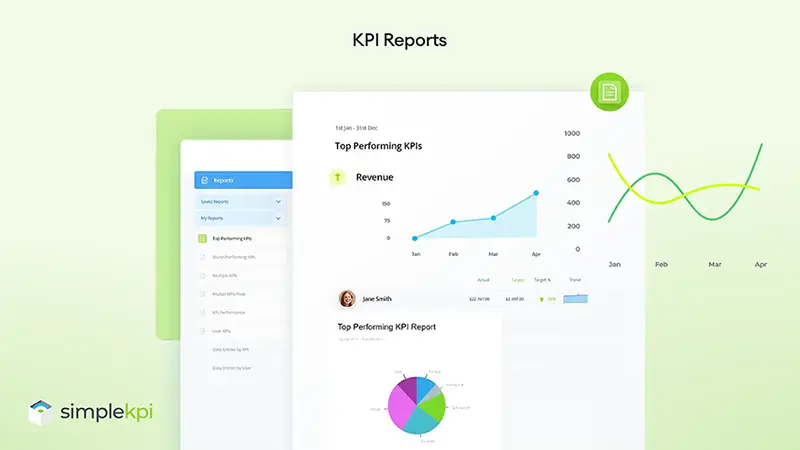
Reports are best served when they are distributed directly to team members or individuals regularly or in support of scheduled meetings where decisions based on the data need to be made.
Working Examples of KPIs
Let’s delve into some working examples of Key Performance Indicators (KPIs). These metrics play a crucial role in assessing performance and guiding strategic decisions. Here are a couple of examples, covering arguabley the most common KPIs for Sales and Marketing:
Popular Sales KPIs
-
Annual Contract Value (ACV)
ACV represents the average annual revenue generated from a single customer contract. It helps assess the value of long-term customer relationships.
Formula:
ACV = (Total Contract Value) / (Number of Years in Contract) -
Customer Lifetime Value (CLV)
CLV estimates the total revenue generated by a customer over the entire relationship with your business. It guides customer retention efforts.
Formula:
CLV = (Average Annual Revenue per Customer) × (Average Customer Lifespan) -
New Leads in Pipeline
This KPI tracks the number of new potential customers entering your sales pipeline. It reflects the effectiveness of lead generation efforts.
Formula:
Count of New Leads -
Average Age of Leads in Pipeline
Measures how long leads have been in the pipeline. A shorter lead age indicates faster conversion.
Formula:
Sum of Lead Ages / Number of Leads -
Conversion Rate
The conversion rate shows the percentage of leads that turn into paying customers. It’s a critical metric for assessing sales effectiveness.
Formula:
Sum of Lead Ages / Number of Leads -
Rep Retention
Evaluate the tenure of sales representatives. High rep retention indicates a stable and motivated sales team.
Formula:
(Number of Reps Retained) / (Total Number of Reps) × 100
Explore more Sales KPIs, including growth and performance, on an example Sales KPI Dashboard.
Popular Marketing KPIs
-
Churn Rate
Reflects the percentage of customers who seize using products or services over a specific period. A High churn rate may indicate potential issues.
Formula:
(Lost Customers ÷ Total Customers at the begining of period) x 100 -
Subscriber Count Growth Rate
This KPI tracks the rate at which your email or newsletter subscriber base grows. It helps evaluate the success of your subscription acquisition efforts.
Formula:
(new subscribers - Unsubscribes - Hard Bounces)/Subscriber List Size -
Traffic to MQL (Marketing Qualified Lead) Ratio
Measures the efficiency of lead generation. It assesses the quality of leads generated from website traffic.
Formula:
(MQLs/Leads Generated)*100 -
Published Marketing Content:
Tracks the frequency and quality of content published (blogs, articles, videos, etc.). It reflects content marketing efforts.
Formula:
Count of Published Content -
Video View Counts per Channel
Monitors the number of views for marketing videos across different channels (YouTube, social media, website). It gauges video engagement.
Formula:
Count of Video Views -
Click-through Rate (CTR)
CTR measures the percentage of visitors who click on a specific link or call-to-action (CTA) within an email, ad, or webpage. It reflects engagement and the effectiveness of your content.
Formula:
(clicks/impressions) x 100
Explore more Marketing KPIs, including ROI and Retention, on an example Marketing KPI Dashboard.
Discover more KPI templates and Examples
Get expert-inspired KPI dashboard examples across industries and departments. These flexible, customizable templates provide a solid starting point for tracking KPIs, metrics, and business data.
KPI Best Practice
What makes Key Performance Indicators so effective? What sets them apart from just plain old data measurements? Here are five factors that can be the difference between mediocre data recording and a genuinely effective business improvement exercise:
- Keep Aligned. KPIs should track the performance of a specific business objective to help achieve the company's larger goals. Being closely aligned to key measurements will help you focus on influencing factors to reach these goals. If a KPI is neither aligned nor specific, is it needed?
- Less is more. In a world full of data, tracking too much and too often is far too easy. It's a common mistake to measure everything connected to the business. Starting with a small number of specific KPIs will not only be far easier to implement but will also help with the adoption of KPIs within the organization.
- Actionable and accountable. KPIs without clear and relevant targets are simply measurements that are limited in how you can influence their performance. Short and long-term targets should be set for KPIs, along with owners who are responsible and can influence business processes.
- Attainable. Can we realistically achieve this objective? Do we have the capacity to change or amend processes that will influence the performance? KPIs should be realistic and proportionate to the resources of a business. Nothing will stop a well-intentioned performance improvement process than an over-ambitious and unattainable objective.
- Review and tweak. As with any business process, KPIs also need timely scrutiny or maintenance to keep them performing at their best. Setting regular review periods will keep them relevant and provide optimum benefits.
An example of a KPI would be Monthly Customers per Sales Representative: This KPI measures the number of new customers acquired by each sales representative per month.
An example of a SMART KPI would be Customer Satisfaction. Measuring customer satisfaction (e.g., through surveys or Net Promoter Score) is specific, measurable, achievable, relevant, and can have a time-bound target.
Yes. KPIs can be tracked using spreadsheets for basic individual usage or small teams. However, more extensive data volumes, departments, or users would require dedicated KPI software.
A calculated KPI is a specific performance metric derived from calculations or formulas. It reflects a targeted performance aspect and helps organizations make informed decisions to help achieve their goals.
Monthly and quarterly are often considered the most commonly used time periods for updating KPIs. However, some companies may need to track in short periods, like daily or weekly, depending on how the data is used.

by Stuart Kinsey
Stuart Kinsey writes on Key Performance Indicators, Dashboards, Marketing, and Business Strategy. He is a co-founder of SimpleKPI and has worked in creative and analytical services for over 25 years. He believes embracing KPIs and visualizing performance is essential for any organization to strive and grow.