Youth Homelessness Prevention Performance Dashboard
A 20-year-old has been sleeping on a friend's couch for three weeks, and the friend's landlord has started asking questions. He walks into a youth drop-in center and gets enrolled in a rapid re-housing program. From that day, the number that matters most, to him and to the program, is how many days it takes until he has a key to a place of his own.
In the official count, youth homelessness fell. HUD's 2025 Annual Homelessness Assessment Report counted 35,159 unaccompanied young people under 25 on a single night in January 2025, 8% fewer than in 2024, and 93% of them were aged 18 to 24. But the count covers shelters, transitional housing and the street. The young man on the couch isn't in it.
Chapin Hall's Voices of Youth Count, a national study reported to HUD in 2018, asked about a whole year instead. It found that 1 in 10 young adults aged 18 to 25, more than 3.5 million people, had some experience of homelessness, and about half of those experiences were couch surfing. More than a third of the homeless young adults it surveyed had no high school diploma or equivalent.
Continuums of Care report HUD's System Performance Measures, seven areas that run on the federal fiscal year and include length of time homeless, returns to homelessness and exits to permanent housing. The providers they fund are judged on the same terms. This program is fictional: a nonprofit youth housing provider in a mid-sized US city. Its monthly figures are modeled, not taken from a real organization, and its 24 months line up with fiscal 2025 and 2026.
What is a Youth Homelessness KPI Dashboard?
Overview
A youth homelessness KPI dashboard shows how quickly young people get from enrollment into a home of their own, whether they're still housed a year later, and what it took in staff time and money to get them there.
It starts at the front door. Youth served is the volume. Shelter diversion rate is the prevention side: young people asking for a shelter bed who could stay safely with family or friends, or keep their own place, with some help.
For everyone else, length of time homeless is the wait: average days from program entry to move-in. Exits to permanent housing shows where young people went when they left the program. Education or employment at exit and permanent connections at exit cover two of the four core outcomes in the USICH youth framework: school, training or a job, and at least one adult they can call on.
Returns to homelessness within 12 months is the long check: who came back to a shelter, a transitional program or the street within a year. Caseload per case manager and cost per successful exit say whether the staff and the budget can keep it up.
Who benefits from this dashboard?
- Program Director: Length of time homeless and exits to permanent housing are among the measures the CoC weighs at renewal. A 12-month trend of both says whether the program is getting better or worse.
- Case Management Supervisor: Caseload per case manager rises when young people wait longer for housing, usually before anyone feels the strain.
- Housing Locator or Landlord Liaison: Their work shows up almost entirely in length of time homeless. When the list of landlords willing to rent to a 19-year-old with no rental history gets shorter, this is where it lands.
- CoC Lead and HMIS Administrator: They supply the returns data, since only the community-wide HMIS sees a young person who comes back through another provider.
- Funders and Board: Cost per successful exit and returns within 12 months answer the question every grant report asks: what did the money buy, and did it last?
Don't set the target for an average from a maximum. USICH's youth benchmark is a 30-day average with 90 days as the longest any young person should wait. A program that puts 90 on its average-days chart will show green right up until the average young person waits three months.
Dashboard Example Overview
The example program runs rapid re-housing and shelter diversion for young people aged 18 to 24.
It has 14 case managers and serves around 300 young people each month, with funding from its local Continuum of Care, the county and private donors. It reports monthly against nine KPIs:
- Youth Served: Unduplicated young people with an open housing enrollment or a shelter request in the month. No target: it's context for caseload and cost, and it can rise for the wrong reason, when young people stay enrolled longer.
- Shelter Diversion Rate: Young people asking for shelter who were safely diverted, divided by shelter requests. Diversion might be a conversation, mediation with family, bus fare or a grocery card: whatever lets a young person stay somewhere safe.
- Length of Time Homeless: Average days from program entry to housing move-in, for young people who moved in during the month. This is the National Alliance to End Homelessness rapid re-housing definition, and its benchmark is 30 days or less.
- Exits to Permanent Housing: Young people who left for a permanent destination, divided by everyone who left. Unknown destinations count as not permanent, so losing touch counts against the program.
- Returns to Homelessness Within 12 Months: Of the young people who exited to permanent housing in the 12 months ending a year ago, the share who show up in HMIS again at a shelter, transitional program or street outreach within 12 months. It's a rolling cohort, so it moves slowly and late.
- Education or Employment at Exit: Young people in school, training or work when they leave. It dips every summer when classes end.
- Permanent Connections at Exit: Young people who can name at least one adult, a parent, relative, mentor or former foster parent, they can rely on after the program ends.
- Caseload per Case Manager: Open housing enrollments at month end divided by 14 full-time case managers.
- Cost per Successful Exit: Total program spend in the month, including staff, rental assistance and holding fees, divided by exits to permanent housing.
In October 2024, the board looks healthy.
Young people wait an average of 44.2 days from entry to move-in, and 85.0% of exits are to permanent housing. Returns within 12 months are 11.5%, and each case manager carries 14.2 young people.
On the monthly report, length of time homeless shows green against a target of 90 days. That target was copied from the maximum in the county contract.
In February 2025, the program's landlord liaison leaves. The post is held open to cover a gap in the county contract, and case managers pick up landlord calls between appointments.
That month, the average wait actually falls, from 46.3 days to 45.8.
Then it creeps.
It's 48.9 days in March, 50.4 in April, 49.7 in May, 53.1 in June and 58.8 by September. It never rises more than four days in a month, and it dips twice, in May and August. Each time, the monthly review reads it as the number settling.
Against a 90-day target, it stays green the whole way.
Caseload per case manager drifts from 14.3 to 15.9 over the same months. Youth served rises from 290 to 309, while shelter requests barely move.
The program isn't seeing more young people. It's holding them longer.
In November 2025, the CoC's HMIS lead sends providers their fiscal 2025 performance extract.
The program's data manager puts 13 months of length of time homeless on one trend line, October 2024 to October 2025. It climbs from 44.2 days to 61.2 with almost no breaks.
Exits to permanent housing have slid from 85.0% to 77.8% over the same period, because young people who wait longer go back to friends' couches or stop answering the phone. Both count as non-permanent exits.
The fix is dull, and it starts in January 2026.
The landlord liaison post is filled. The program pays holding fees of up to two weeks' rent so a unit isn't lost while an inspection or a deposit clears.
Case managers meet for 30 minutes every Monday to go through every young person past day 30 of their search.
The length of time homeless target is reset to 45 days, and the 12-month trend line moves to the top of the monthly review. Together it adds about $16,000 a month.

Nothing changes quickly.
The average wait peaks at 70.8 days in January 2026, as young people who'd been searching since the fall finally move in. Then it falls a few days a month: 66.1 in March, 60.2 in May, 52.3 in September. That's still above the 45-day target.
Exits to permanent housing bottom out at 75.0% in February and are back to 81.6% in August. Caseload per case manager goes from 17.6 in January to 15.0 in September.
Cost per successful exit peaks at $13,004 in February, when the new spending arrived before the extra move-ins did. By September, it's $10,031.
Two outcomes barely notice.
Education or employment at exit dips each summer, to 56.4% in June 2025 and 55.0% in July 2026.
Permanent connections at exit stays between 77.8% and 84.6%, under its 85% target every month: a mentoring gap, not a housing one.

And one number is going the wrong way.
Returns to homelessness within 12 months sit between 11.1% and 11.9% for 18 months. Then they climb from 11.7% in March 2026 to 15.1% in September, past the 15% target for the first time.
It's the lag.
The September figure counts young people who exited from October 2024 to September 2025, the drift months. Some took the first room they were offered after a long search, often a shared one, and more of those arrangements broke down.
The young people who waited longest, housed between October 2025 and February 2026, won't reach their 12-month mark until late 2026 or early 2027. So the program expects this line to get worse before it improves.
It has added a check-in 90 days after move-in for anyone who waited more than 60 days.
Creating a Youth Homelessness Prevention Dashboard in SimpleKPI
-
Step 1 Decide where the homelessness clock starts
HUD's Measure 1 counts nights in shelter and transitional housing recorded in HMIS. The NAEH rapid re-housing benchmark counts from program entry to move-in. USICH counts from the day a young person is identified as homeless. A young person who couch surfs for a month before enrolling looks very different under each. Choose one, write it on the KPI and keep it.
Still choosing what goes on the board? The guide to choosing KPIs covers the basics.
-
Step 2 Get returns data from the CoC's HMIS lead
Your case files only show young people who come back to you. Returns need the community-wide HMIS, so agree a monthly extract with the HMIS lead, with the exit cohort and look-back defined as in SPM Measure 2.
-
Step 3 Code exit destinations the same way every time
Moving back in with a parent can be a permanent exit or a few weeks on a couch, depending on whether anyone expects it to last. Agree what counts with case managers, ask the question the same way at every exit interview, and treat "don't know" as not permanent. A program that's generous here will see its exits number rise and its returns number follow a year later.
-
Step 4 Run the board on the federal fiscal year
The System Performance Measures run October 1 to September 30. Set the dashboard's year the same way, so the 12 months the program reviews in September are the 12 months the CoC submits to HUD.
List of Youth Homelessness Prevention KPIs
Three targets come from the National Alliance to End Homelessness rapid re-housing benchmarks, and the table names them. The others have no published benchmark for youth programs, so treat them as places to start.
| KPI Name | Typical Target | Description / Calculation |
|---|---|---|
| Youth Served | No target (context) | Unduplicated young people aged 18 to 24 with an open housing enrollment or a shelter request in the month. |
| Shelter Diversion Rate | ≥ 28% (starting point) | Young people safely diverted from shelter divided by shelter requests in the month. |
| Length of Time Homeless | ≤ 45 days (NAEH benchmark 30) | Total days from program entry to move-in for young people who moved in during the month, divided by the number who moved in. Lower is better. |
| Exits to Permanent Housing | ≥ 80% (NAEH benchmark 80%) | Exits to a permanent housing destination divided by all exits in the month. Unknown destinations count as not permanent. |
| Returns to Homelessness Within 12 Months | ≤ 15% (NAEH benchmark 15%) | Young people from the 12-month exit cohort ending a year ago who returned to shelter, transitional housing or street outreach in HMIS within 12 months, divided by that cohort. Lower is better. |
| Education or Employment at Exit | ≥ 60% (starting point) | Young people in school, training or work at exit divided by young people who exited. |
| Permanent Connections at Exit | ≥ 85% (starting point) | Young people who name at least one supportive adult at exit divided by young people who exited. |
| Caseload per Case Manager | ≤ 15 (starting point) | Open housing enrollments at month end divided by full-time-equivalent case managers. Lower is better. |
| Cost per Successful Exit | ≤ $10,000 (starting point) | Total program spend in the month, including staff, rental assistance and holding fees, divided by exits to permanent housing. Lower is better. |
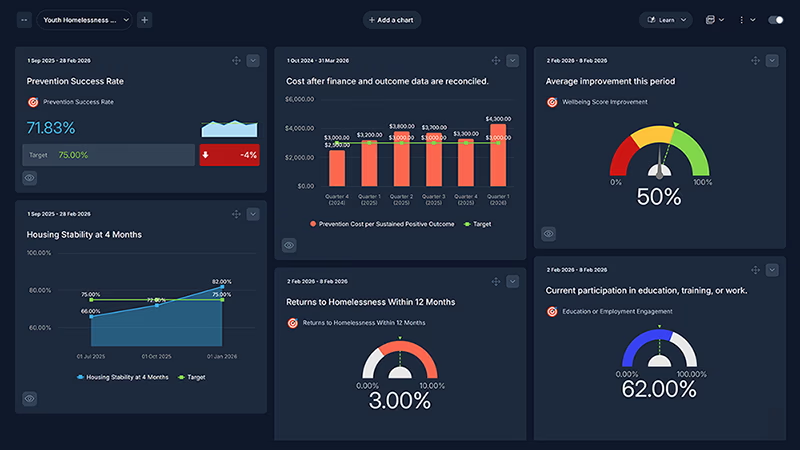
For a prevention-focused starting set, download the youth homelessness prevention KPI spreadsheet. It holds eight measures from an earlier version of this page, including prevention success rate, time from risk flag to first contact and wellbeing score improvement, each set out with its unit, frequency and direction.
Why Youth Homelessness Dashboards Matter
Trouble in a youth housing program tends to build quietly. A landlord sells a building. A friendly property manager retires. Rents near the bus line go up a little each lease cycle. None of it makes a bad month, so a review that compares this month with last will miss it.
These nine numbers also trade against each other. Push length of time homeless down hard and returns can follow a year later, because the fastest unit isn't always one a young person can keep. Divert more young people at the front door and exits to permanent housing can fall, because the young people left in the program are the ones with the fewest options. Move a young person across town for a cheaper apartment and education or employment at exit can drop, because the job or the community college was on the other side.
So read them in pairs, and read them as trends: length of time homeless against returns within 12 months, diversion against exits to permanent housing, caseload against cost per exit. The local government dashboard example shows a similar pull from the city side, where easier access raises demand and service times stretch, and the non-profit example covers the fundraising that pays for programs like this one.
For the young man on the couch, the trend line is the difference between a 45-day search and a 70-day one. Put 12 months of length of time homeless at the top of every monthly review, next to the target the program actually wants, and the next slow drift shows up in the third month instead of the thirteenth.
Building it in SimpleKPI
Build this dashboard yourself with SimpleKPI's KPI dashboards, or start from the Library KPIs template. The mechanics are the same whatever you track:
- KPIs: each one gets a target, an entry frequency and tags, so you can report by team, site, product or whatever you split the numbers by.
- Data: type numbers in, import a spreadsheet, or use an integration or the API. The dashboard updates as each number lands, so daily and monthly KPIs sit side by side.
- Reports: scheduled KPI reports email the numbers to people who never log in.
- AI: Kip, the built-in AI, suggests targets and flags indicative benchmarks (AI estimates, not peer data) once some history builds up.
- Price: $79 a month for unlimited users and KPIs, as one flat price, with a 14-day free trial and no card needed.