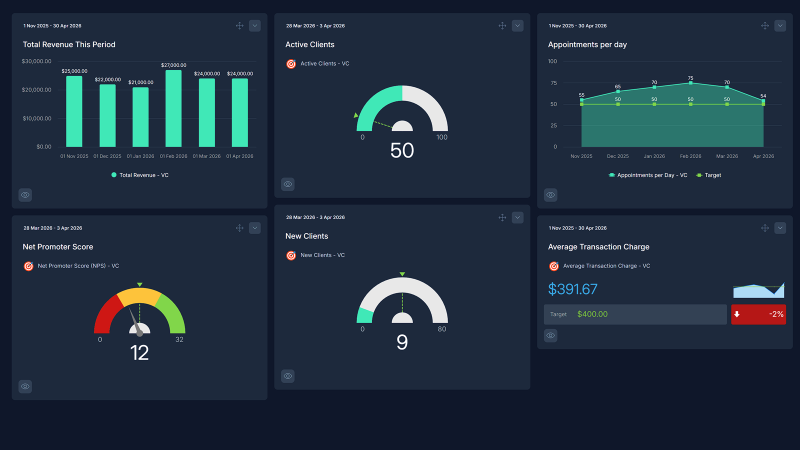
Veterinary Clinic Performance Dashboard
Twenty minutes after the phones open, the front desk has already told three callers that the first wellness slot is more than two weeks out. One has a dog due for its heartworm test. The other two are new to the area and will probably book with whoever answers next. The schedule is full. The question is whether you can grow it without breaking the people working it.
Demand isn't the problem. BLS counts 91,100 veterinarians in 2025 and expects 9% growth to 2035. Technicians are the harder hire: the same handbook expects about 13,400 openings a year for a workforce of 131,400, at a May 2025 median wage of $47,380.
Productivity has been drifting the wrong way. The AVMA's 2025 practice owner survey, reported in AVMA News in October 2025, found 2024 revenue per veterinarian of $554,982, down in real terms from nearly $600,000 in 2019, and active clients per veterinarian falling about 15 a year since 2019, to 1,499. Fees kept climbing anyway: the BLS consumer price index for veterinarian services rose 5.7% from August 2025 to August 2026, against 3.4% for all items.
This example follows an invented companion-animal practice in suburban Ohio. It isn't a SimpleKPI customer, and every monthly figure is modeled. Four of the ten targets lean on a published AVMA or AAHA figure; the rest are starting points.
What is a Veterinary Clinic KPI Dashboard?
Overview
A veterinary clinic KPI dashboard shows whether your doctors are busy with the right appointments, whether clients can get in and come back, and whether the technicians behind the exam room doors are staying.
It starts with doctor time. Patients per veterinarian per day is the capacity number. Revenue per FTE veterinarian and average transaction charge show what that time earns, and whether a good month came from more pets or bigger invoices.
Then the clients. New clients per month shows whether the phone is turning into first visits. Days to the next routine appointment is what a caller hears from the front desk, and it's usually the first number to move when the book is too full. Active clients per FTE veterinarian shows whether the client base is big enough for the doctors you're paying.
Preventive care compliance is the share of active patients who had a wellness exam in the last year. It's where medicine and revenue meet: an overdue senior cat is both a missed diagnosis and a missed invoice.
Last come the people who make the rest possible. Credentialed technicians per veterinarian and technician turnover tell you whether the team can hold the pace. Operating profit margin, with every doctor paid a market salary, is the check on all of it.
Who benefits from this dashboard?
- Practice Owner: Revenue per FTE veterinarian and operating margin, read together, answer the question behind every hiring decision. Can the practice carry another doctor, and what will it cost in the first six months?
- Practice Manager: Days to next routine appointment and the technician ratio are the weekly scheduling numbers. When one rises and the other falls, the shifts need to change before anyone resigns.
- Associate Veterinarians: Patients per day and preventive care compliance by doctor show who is rushed and whose wellness recommendations are landing, without anyone guessing.
- Lead Technician: Turnover and the ratio give the technician team a number to bring to the owner. That gets further than "we're stretched."
- Client Service Team: New clients and the next-available wait tell the front desk when to offer a waitlist and when to book a new client straight in.
Calculate operating margin as if every veterinarian, the owner included, drew a market-rate associate salary. An owner who takes profit instead of pay makes the practice look several points more profitable than it is, and the gap shows up the day they sell or hire a replacement.
Dashboard Example Overview
The practice is a small-animal hospital with four exam rooms, a mostly dog-and-cat caseload and about 3,200 active clients at the start. It begins with two veterinarians, the owner and one associate, and four credentialed technicians. It reports monthly against ten KPIs:
- Revenue per FTE Veterinarian: Gross revenue for the month divided by full-time-equivalent veterinarians. The AVMA's 2024 average works out to about $46,250 a month.
- Patients per Veterinarian per Day: Patients examined by a veterinarian divided by doctor days worked. Technician-only appointments are left out, so moving boosters to technicians lowers it on purpose.
- Average Transaction Charge: Visit invoice revenue divided by client invoices. Online pharmacy sales are left out because they aren't a visit. A client with two cats on one visit is one invoice.
- New Clients per Month: Clients whose first-ever invoice falls in the month.
- Active Clients per FTE Veterinarian: Clients with an invoice in the last 12 months divided by FTE veterinarians. Some practices use 18 months; pick one and keep it.
- Preventive Care Compliance: Active patients with a wellness exam in the last 12 months, as a share of active patients.
- Days to Next Routine Appointment: Business days from a booking call to the first open 30-minute wellness slot with any doctor, checked every Monday and averaged.
- Credentialed Technicians per Veterinarian: Credentialed technician FTEs (CVT, LVT or RVT, depending on the state) divided by FTE veterinarians, at month end.
- Credentialed Technician Turnover Rate: Technicians who left in the last 12 months divided by average technician headcount over the same 12 months. Because it's a trailing number, it stays high for a year after a bad quarter.
- Veterinary Operating Profit Margin: Revenue less all operating costs, with every veterinarian paid a market salary, as a share of revenue.
In October 2024 the practice is busy and lean. Each doctor sees 15.9 patients a day, revenue per FTE veterinarian is $51,940, and the first routine slot is 9 business days away. There are two credentialed technicians for every doctor.
Demand keeps climbing through the spring. By May 2025 the doctors are seeing 17.4 patients a day, revenue per FTE veterinarian is $62,965 and margin is 18.4%, the best of the two years. But the wait for a routine appointment has reached 16 business days, new clients are stuck around 50 a month because the front desk is turning them away, and preventive care compliance has slipped from 64.2% to 61.0%. Pets that were due couldn't get in.
So in June 2025 the owner hires a second associate and one more technician. One, not two, and that becomes the story. The first month looks bad on paper: 12.6 patients per doctor per day, revenue per FTE veterinarian down to $45,595, just under the AVMA average, and margin at 3.0%. Active clients per FTE veterinarian falls from 1,609 to 1,079 overnight, because the clients didn't change and the doctor count did. The wait drops to 8 days.
In September 2025 the practice adds extended hours: Monday to Thursday until 8pm, and Saturday mornings. It works. The wait is 3 days in September and 2 in November. New clients reach 88 in September and 95 in January 2026. By February each doctor is back to 17.3 patients a day, and January's fee increase lifts revenue per FTE veterinarian to $59,958.
The evenings and Saturdays fall on the same five technicians. One resigns in December 2025 and another in February 2026. The ratio drops to 1.0 technician per doctor, and trailing turnover jumps from zero in November to 45.3% in February. Preventive care compliance, which had recovered to 65.9% in November, falls to 59.3% by March 2026, the lowest of the two years. Reminder calls and wellness rechecks were technician work, and nobody had time for them. Relief technicians and overtime hold margin to 12.2% in February, even with higher fees.
In March 2026 the owner decides what to give up. Saturdays go, and late evenings drop from four nights to two. New clients go on a waitlist instead of straight into the book. Technician pay goes up; two credentialed technicians start in April, one more in June and another in August. Vaccine boosters, nail trims and suture removals move to technician appointments, the kind of shift AAHA's 2023 Technician Utilization Guidelines argue for.
The price is visible on the board. New clients fall from 91 in March to 61 in April and 58 in September. The routine wait goes back up to 6 days in April and May, then settles at 5. Average transaction charge drops from $185.79 in March to $172.27 in September, because a booster appointment is a smaller invoice. That one was expected. The number the owner didn't want is turnover: a third technician, who had already accepted another job, leaves in April. Trailing turnover peaks at 69.2% and is still 66.7% in September, and it won't fall far until the December departure drops out of the window.
By September 2026 the ratio is back to 2.0, preventive care compliance has climbed to 63.9%, still short of the 70% target, and each doctor sees 15.6 patients a day. Revenue per FTE veterinarian is $61,787 and margin is 14.7%. Active clients per FTE veterinarian is 1,193, well under the AVMA's 1,499. The third doctor was hired ahead of the client base, and with the waitlist that gap will close slowly. It was a deliberate trade.
Creating a Veterinary Clinic Dashboard in SimpleKPI
-
Step 1 Define an active client, a transaction and a compliant patient
Is an active client one seen in 12 months or 18? Is a two-cat visit one transaction or two? Does a rabies-only visit count toward wellness compliance? Each choice can move a KPI by 10 points or more, and the AVMA and AAHA surveys you'll compare against have their own definitions. Write yours down, and use the same ones at every location.
For a broader look at choosing measures, read the KPI selection guide.
-
Step 2 Know whether the PIMS, payroll or the accountant owns each number
The practice management system knows invoices, patients, clients, compliance and the schedule. Payroll knows technician headcount, hours and who left. Operating margin comes from the accountant's monthly P&L, with the owner's pay adjusted to a market salary. Days to next routine appointment and technician turnover are the two where a smaller number is the good news.
-
Step 3 Put access at the front desk and margin in the owner's office
The front desk and lead technician start each day with days to next routine appointment and today's technician coverage. The doctors look at patients per day, average transaction charge and compliance by doctor once a month. Revenue per FTE veterinarian, margin, the technician ratio and turnover go to the owner, set against the same month a year earlier.
-
Step 4 Cost every new doctor in technicians before you hire
Before an associate's start date, work out the technician ratio on day one, and what it'll be if one technician leaves. Then watch the ratio and turnover together for the next six months. A hire that adds a doctor without the team around them shows up as faster appointments first and resignations second. For turnover across a whole workforce, the HR dashboard example goes further.
List of Veterinary Clinic KPIs
Revenue per veterinarian, patients per day and active clients per veterinarian have an AVMA survey average to compare against, and the turnover target follows an example goal in AAHA's guidelines. The rest are marked starting point: set them from your own last twelve months.
| KPI Name | Typical Target | Description / Calculation |
|---|---|---|
| Revenue per FTE Veterinarian | ≥ $50,000 a month (AVMA 2024 average $554,982 a year) | Gross revenue divided by FTE veterinarians. Falls when a new doctor starts. |
| Patients per Veterinarian per Day | 15 (AVMA survey average about 15) | Patients examined by a veterinarian divided by doctor days worked. Technician-only appointments excluded. |
| Average Transaction Charge | ≥ $175 (starting point) | Visit invoice revenue (online pharmacy excluded) divided by client invoices. |
| New Clients per Month | ≥ 60 (starting point) | Clients whose first-ever invoice falls in the month. |
| Active Clients per FTE Veterinarian | ≥ 1,500 (AVMA 2024 average 1,499) | Clients with an invoice in the last 12 months divided by FTE veterinarians. |
| Preventive Care Compliance | ≥ 70% (starting point) | Active patients with a wellness exam in the last 12 months divided by active patients. |
| Days to Next Routine Appointment | ≤ 5 business days (starting point) | Business days from booking call to the first open wellness slot, sampled weekly and averaged. Lower is better. |
| Credentialed Technicians per Veterinarian | ≥ 2.0 (starting point) | Credentialed technician FTEs at month end divided by FTE veterinarians. |
| Credentialed Technician Turnover Rate | < 10% (AAHA example goal) | Technicians who left in the last 12 months divided by average technician headcount over those months. Lower is better. |
| Veterinary Operating Profit Margin | ≥ 15% (starting point) | Revenue less operating costs, with market-rate pay for every veterinarian, divided by revenue. |
Want a list to start from? Download the veterinary clinic KPI spreadsheet. It's an older, wider list of 10 general clinic KPIs, including appointments per day, average wait time, no-show rate and Net Promoter Score, so keep the ones your team will actually review. To build a set around your own practice, try the KPI generator.
Why Veterinary Clinic Dashboards Matter
Nearly every gain on a practice's board has a cost somewhere else on it. Patients per veterinarian per day going up looks like efficiency, until preventive care compliance drops because wellness exams got shorter and nobody made the reminder calls. Extended hours shorten the wait, until technicians are covering every evening and the resignation letters start. Adding a doctor lowers revenue per FTE veterinarian and active clients per veterinarian before it raises anything.
Technician turnover is the slow one. The example practice lost two of its five technicians between December and February and still posted its highest revenue to date in March, because the doctors kept running on the team that remained. AAHA's guidelines put the cost of replacing one credentialed technician at about $24,000, plus about $35,000 of lost income over a 40-day vacancy, and the authors consider both figures low. None of that shows on the revenue line until it's already spent.
The hard decisions in a growing practice are about what to give up: new clients, Saturday hours, a shorter wait, or the people. The example practice gave up the first three to keep the fourth. A board that shows the technician ratio next to the appointment wait is what lets an owner make that choice in March, not after the next resignation. Dentists face a version of the same squeeze with hygienists, which the dental practice example tracks.
So before you sign the next associate, look at two numbers: technicians per veterinarian on their first day, and technician turnover over the last year. If the first is under two and the second is climbing, hire the technicians first.
Building it in SimpleKPI
Build this dashboard yourself with SimpleKPI's KPI dashboards. The mechanics are the same whatever you track:
- KPIs: each one gets a target, an entry frequency and tags, so you can report by team, site, product or whatever you split the numbers by.
- Data: type numbers in, import a spreadsheet, or use an integration or the API. The dashboard updates as each number lands, so daily and monthly KPIs sit side by side.
- Reports: scheduled KPI reports email the numbers to people who never log in.
- AI: Kip, the built-in AI, suggests targets and flags indicative benchmarks (AI estimates, not peer data) once some history builds up.
- Price: $79 a month for unlimited users and KPIs, as one flat price, with a 14-day free trial and no card needed.