Dental Practice Performance Dashboard
It's 7:45 on a Monday and the hygiene column at one office has three open hours before lunch. Twelve miles away, the group's other office is booked solid and working its short-call list. Same owner, same fee schedule, same practice management software. The difference sits in a number many practices check once a year, if that: how many hygiene patients left last time with their next cleaning already booked.
Solo practice is no longer the norm in dentistry. In the ADA Health Policy Institute's 2025 workforce report, only 34% of US dentists practiced alone in a single location in 2024, and 10% worked in practices with 2 to 9 locations. Once there's a second office, the owner can't stand in both hygiene rooms, so the comparing has to happen somewhere else.
Hygiene is also the hardest chair to staff. In the institute's Q2 2026 dental economy report, nearly 2 in 5 dentists were recruiting hygienists, and the vast majority of them called it very or extremely challenging. The same report shows reimbursement, averaged across payers, up 19% since January 2021 against 27% inflation, while dental office staff earnings rose 23%. With fees lagging costs, an empty hygiene hour is money the practice doesn't get back.
The practice on this page is invented: a two-office general dentistry group in the Midwest, called the north and south offices here. Treat the numbers as a modeled example, not as anyone's actual results.
What is a Dental Practice KPI Dashboard?
Overview
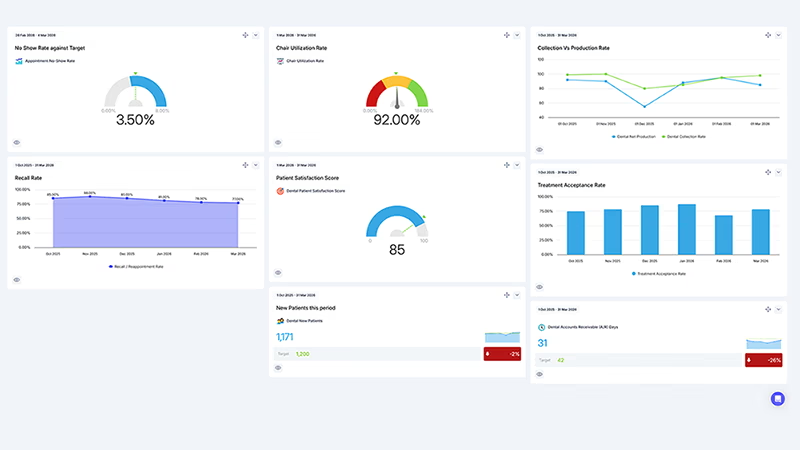
A dental KPI dashboard puts each office's schedule, treatment plans and money on one screen, so you can see whether patients come back, say yes to care and pay for it.
It starts with who walks in. New dental patients shows whether the phones and referrals are bringing people through the door. Hygiene reappointment rate shows whether the people already in the chair leave with their next visit booked. Patient retention rate is the slow, lagging version of the same question: of the patients you saw a year or two ago, how many came back?
Then the day itself. Patient no-show rate counts the appointments that broke, and chair utilization counts the staffed chair hours that actually had a patient in them. A full book at 7 a.m. means little if a tenth of it doesn't show.
Exams turn into treatment plans, and case acceptance rate tells you how much of the dentistry you diagnosed patients agreed to. Production per provider day turns the schedule into dollars for each dentist or hygienist day worked.
Last comes the money. Net collection rate shows how much of that production you collected, and A/R over 90 days shows how much is drifting toward never being collected at all.
Who benefits from this dashboard?
- Owner Dentist: With two offices, the owner can't see both schedules from one operatory. Comparing the offices on rates rather than totals shows where the next hygienist, or the next fix, should go.
- Office Manager: No-show rate and chair utilization belong in the morning huddle. They're the numbers the front desk can move by Friday.
- Lead Hygienist or Hygiene Coordinator: Reappointment rate by hygienist shows who books in the chair and who leaves it to the front desk. Retention shows what that habit costs a year later.
- Treatment Coordinator: Case acceptance by dentist and by plan size separates a presentation problem from a patient-finance one.
- Billing Coordinator: A/R over 90 days is their early warning. It moves weeks before the net collection rate does.
Measure reappointment against the hygiene patients who left the chair, not against your whole recall list. An office can book 90% of today's patients and still have hundreds of overdue patients nobody has called, which is why patient retention rate sits on the same board.
Dashboard Example Overview
The group runs two general dentistry offices about 12 miles apart, each with two dentists and three hygienists, open four days a week. The north office has seven operatories, the south six. They share one fee schedule, the same PPO contracts, one practice management system and one marketing budget. Nine KPIs, reported monthly for each office and for the group:
- New Dental Patients: First-time patients who completed a first visit in the month. Calls and bookings that never sat in a chair don't count.
- Hygiene Reappointment Rate: Hygiene patients who left with their next hygiene visit booked, divided by hygiene patients seen. It's the leading measure for almost everything else on the board.
- Case Acceptance Rate: Dollar value of treatment accepted, divided by dollar value presented in the month. Counted in dollars, so one accepted implant isn't worth the same as one accepted filling.
- Chair Utilization Rate: Chair hours used for patient care, divided by staffed chair hours available (provider days times eight hours). An operatory with no dentist or hygienist that day isn't counted as available.
- Production per Provider Day: Net production divided by dentist days plus hygienist days worked. It lets a six-chair office and a seven-chair office be compared fairly.
- Net Collection Rate: Collections divided by net production, meaning production after contractual PPO write-offs. Anything well under 100% over a few months is money that was owed and not collected.
- Dental A/R Over 90 Days: Patient and insurance receivables older than 90 days, as a share of all receivables at month end. Lower is better.
- Patient No-Show Rate: Broken appointments, meaning no-shows plus cancellations with under 24 hours' notice, divided by appointments scheduled. Lower is better.
- Dental Patient Retention Rate: Patients seen 13 to 24 months ago who've had a visit in the last 12 months, divided by patients seen 13 to 24 months ago. Rolling, so it moves slowly.
In October 2024 the two offices look like twins. North reappoints 68.0% of its hygiene patients and South 69.2%. Chair utilization is 78.5% at North and 80.4% at South, and the no-show rate 10.6% and 9.4%. Production per provider day is $2,406 against $2,375.
In March 2025, North changes how recall works, and South doesn't. At North the hygienist now books the next visit in the chair, before the patient sits up, so the front desk confirms a booking instead of asking for one. The front desk spends an hour every afternoon on the unscheduled list: patients past due with nothing booked. And every appointment gets a text confirmation two days out, with a short-call list to fill the gaps. South stays with postcard reminders and front-desk calls when the phones are quiet.
The board picks it up within a quarter. North's reappointment rate goes from 70.0% in March to 80.1% in June and 87.9% in September 2025. Chair utilization rises from 80.4% to 87.2% over the same months, and the no-show rate falls from 10.8% to 7.9%.
Case acceptance went the wrong way. North's fell from 59.8% in March to 55.2% in August, with a low of 52.6% in July, because patients who'd been overdue for a year came back with more to fix. In August, North presented $184,200 of treatment against $160,700 in March, and patients accepted $101,600, up from $96,100. The rate fell because the denominator grew, which is why the board's data keeps the dollars alongside the percentage.
Collections slipped too. North's front desk was spending its afternoons on the unscheduled list, and insurance follow-up slid. A/R over 90 days climbed from 12.3% in July 2025 to 20.5% in December, and the net collection rate bottomed at 95.5% in November. In January 2026 the group hired one billing coordinator to cover both offices. By March, North's A/R over 90 days was back to 12.6% and its net collection rate 98.2%.
South had its own bad stretch. One of its hygienists left in August 2025, and a temp covered two days a week until a new hire started in November. Reappointment dropped to 63.8% in August, chair utilization to 74.4% and production per provider day to $2,272. It was easy to blame the vacancy. But with the team back to full strength in November, reappointment returned to 69.6%, roughly where it had sat before the hygienist left. The vacancy was a dent. The recall process was the ceiling.
New patients rule out the other easy explanation. Over the two years North saw 1,052 new patients and South 953, and South's count grew faster: up 6.3% in the second year, against 3.5% at North. Both offices share the same marketing, so the leak wasn't at the front door. It was at checkout.
By September 2026 the gap is plain. North reappoints 89.3% of hygiene patients, runs at 89.7% chair utilization with a 6.8% no-show rate, and produces $2,751 per provider day. Its retention rate has climbed from 74.0% to 82.3%. South reappoints 70.9%, runs at 77.9% utilization, and its no-show rate, which peaked at 13.1% in December 2025, is 11.7%. Production per provider day is $2,391, almost exactly where it started, and retention has slipped from 75.4% to 71.6%. South's billing, at least, was never the problem: its net collection rate stayed between 98.5% and 99.6% throughout.
The group view would have hidden all of it. Combined, reappointment is 81.2% in September 2026 and the no-show rate 9.0%, numbers that look close enough to target to leave alone. The group is starting the same recall process at the south office in October 2026, so the board has nothing to show for it yet.
Creating a Dental Practice Dashboard in SimpleKPI
-
Step 1 Settle what counts as reappointed, broken and collected
Does a recall booked by phone two weeks later count as reappointed? Is a cancellation at 4 p.m. for a 9 a.m. visit a broken appointment? Is collection rate measured against full fees or against net production after PPO write-offs? Each office's practice management system will happily report any of these, so decide once for the group, or the two offices will be compared on two different definitions.
For a wider look at choosing measures, see the KPI selection guide.
-
Step 2 Pull each office from the same report, on the same day
Run the same practice management reports at both offices with the same date settings, after the month's insurance payments are posted. Production entered at completion and production entered at scheduling give different months, and so do collections posted by deposit date and by payment date. Set the direction as you go: A/R over 90 days and no-show rate improve as they fall.
-
Step 3 Match each view to the meeting that uses it
The morning huddle needs yesterday's no-shows, today's open hygiene hours and the unscheduled list. A weekly office meeting needs reappointment by hygienist and case acceptance by dentist. The owner's monthly review needs both offices side by side, plus the group total, against the same month last year.
-
Step 4 Read case acceptance in dollars beside the rate
When recall improves, overdue patients come back with more treatment to present, and the acceptance rate can fall while accepted dollars rise. Production per provider day is the cross-check. If it's climbing, a dip in acceptance may simply mean more dentistry is being diagnosed.
List of Dental Practice KPIs
None of the nine has a national benchmark from the ADA or another dental body, so every target here is this example's starting point. Use your own trailing year to replace them, office by office.
| KPI Name | Typical Target | Description / Calculation |
|---|---|---|
| New Dental Patients | 85 a month for the group (starting point) | First-time patients who completed a first visit in the month. Split by office. |
| Hygiene Reappointment Rate | ≥ 85% (starting point) | Hygiene patients who left with their next hygiene visit booked divided by hygiene patients seen. |
| Case Acceptance Rate | ≥ 60% (starting point) | Dollar value of treatment accepted divided by dollar value of treatment presented. |
| Chair Utilization Rate | ≥ 85% (starting point) | Chair hours used for patient care divided by staffed chair hours available. |
| Production per Provider Day | $2,500 (starting point) | Net production divided by dentist days plus hygienist days worked. |
| Net Collection Rate | ≥ 98% (starting point) | Collections divided by net production after contractual PPO write-offs. |
| Dental A/R Over 90 Days | ≤ 12% (starting point) | Receivables older than 90 days divided by total receivables at month end. Lower is better. |
| Patient No-Show Rate | ≤ 8% (starting point) | No-shows plus cancellations with under 24 hours' notice, divided by appointments scheduled. Lower is better. |
| Dental Patient Retention Rate | ≥ 80% (starting point) | Patients seen 13 to 24 months ago with a visit in the last 12 months, divided by patients seen 13 to 24 months ago. |
More Dental KPIs to Choose From
Nine KPIs suit a two-office general practice. An orthodontic or pediatric office will want others, such as starts per consult or sealant rates. The free KPI generator suggests a KPI set for the practice you describe, with formulas you can export to Excel. If you run another kind of appointment book, the veterinary clinic dashboard example works through many of the same schedule problems.
Prefer to start from a spreadsheet? Download the dental practice KPI spreadsheet, free and with no email needed. It holds the KPI set from an earlier version of this example, so some names differ from the table above: treatment acceptance rate rather than case acceptance, for one.
Why Dental Dashboards Matter
In a dental office the trade-offs run through the front desk. The same two people answer the phones, confirm tomorrow's patients, work the overdue list and chase insurers. Ask them to do more of one and another slips, which is exactly what happened to North's receivables in late 2025.
Chair utilization pulls against the no-show rate in a way that's easy to misread. Double-booking hygiene to cover expected no-shows pushes utilization up and hides the broken appointments behind it, until the day everyone turns up and the hygienist runs 40 minutes late. Case acceptance pulls against recall, as North found: more patients back in the chair means more treatment presented and, for a while, a lower rate.
For a group, the biggest trap is the combined number. Two offices averaging 81% reappointment can mean both are fine, or one at 89% and one at 71%. The second case needs a completely different conversation, and only a split by office will show it.
The staffing pressure isn't going away. BLS counts 225,300 dental hygienist jobs in 2025 and projects about 15,000 openings a year to 2035. When the next hygienist resigns, the office whose patients already leave with their next cleaning booked is the one that rides it out. The reappointment rate tells you which of your offices that is.
Building it in SimpleKPI
Build this dashboard yourself with SimpleKPI's KPI dashboards. The mechanics are the same whatever you track:
- KPIs: each one gets a target, an entry frequency and tags, so you can report by team, site, product or whatever you split the numbers by.
- Data: type numbers in, import a spreadsheet, or use an integration or the API. The dashboard updates as each number lands, so daily and monthly KPIs sit side by side.
- Reports: scheduled KPI reports email the numbers to people who never log in.
- AI: Kip, the built-in AI, suggests targets and flags indicative benchmarks (AI estimates, not peer data) once some history builds up.
- Price: $79 a month for unlimited users and KPIs, as one flat price, with a 14-day free trial and no card needed.