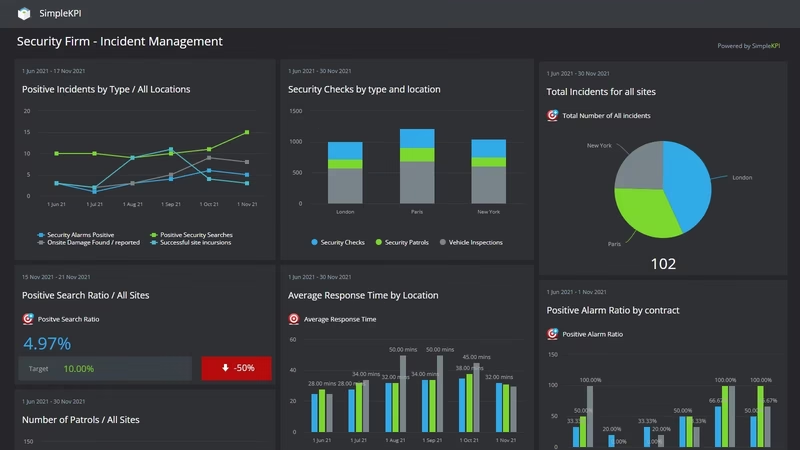
Security Guard Company Performance Dashboard
At 5:40 a.m. at a distribution center gate, the overnight guard has been on post since 6 p.m., the day guard has just texted to say he isn't coming, and the field supervisor has one move left: ask the overnight guard to stay. The post is covered. The schedule shows it filled. What it cost turns up later, on payroll and in the patrol log.
That supervisor is hiring from a market that never stops turning over. BLS counts 1,304,000 security guard and gambling surveillance officer jobs in 2025 and projects just 1% growth to 2035, yet about 157,200 openings a year, most of them replacing guards who change occupations or leave the labor force. Of all security guards, 58% work in investigation, guard and armored car services, where the median wage in May 2025 was $37,350 a year. That's below the $38,020 for guards overall, and well below healthcare ($44,920) and education ($44,250). Contract firms are bidding for the same people as some of their own clients, and paying less.
Then there's the clock. Under federal law, covered employees get time and a half for hours over 40 in a workweek, per the Department of Labor. When a contract bills at a fixed hourly rate, every held-over shift past that line is margin handed back to payroll.
The business in this example is made up: a Texas contract security firm with two branches, Dallas and Houston, about 450 guards and roughly 85 client sites, from office towers to distribution centers and apartment communities. Its monthly figures are modeled.
What is a Security Firm KPI Dashboard?
Overview
A security firm KPI dashboard shows whether every contracted post had a licensed guard on it, what it cost to put one there, and whether the client got the patrols and reports it's paying for.
It starts with the contract. Contracted guard hours is the volume the clients have bought this month. Shift fill rate shows how much of it had a guard on post. Guard license compliance shows whether the guards on that schedule were cleared to stand there, with a current state license and their required training on file.
Next comes the labor behind the coverage. Overtime as a share of hours worked shows how much of that coverage came from guards working past 40 hours. Monthly guard turnover shows how many guards you had to replace to keep the schedule standing.
Then proof of service. Guard tour compliance is the share of checkpoints scanned inside their window, the closest thing a client has to watching the rounds. Incident reports filed on time shows whether problems reached the client within the deadline the contract sets.
Client retention and gross margin per contract sit at the end of the chain. They move last, and they move because of everything above them.
Who benefits from this dashboard?
- Branch Manager: Fill rate, overtime and turnover on one screen show whether the branch is covering posts with people it employs or by wearing out the ones it has.
- Scheduler or Dispatch: The license compliance list tells them which guards can't be posted next week until a renewal or a training record clears, before the schedule goes out rather than after.
- Account Manager: Before a quarterly review, tour compliance and incident report timeliness for that client are what the client's facilities team will bring to the table anyway.
- Owner or CFO: Gross margin per contract, split by branch, answers which offices make money and which only make hours.
- Recruiting and Training: Turnover and license compliance by branch tell them where the next hiring class is needed, and whether new guards are reaching posts before their training is on file.
Never read shift fill rate without overtime next to it. A supervisor who holds the night guard over for a double turns a vacant post into a filled one. Fill rate looks perfect. The cost shows up a week later at time and a half, and in the checkpoint scans missed after hour 12.
Dashboard Example Overview
The example firm runs two branches with the same services, the same nine KPIs and the same targets. Dallas has about 230 guards at the start, Houston about 215. Each branch reports monthly, and the company total is built from both:
- Contracted Guard Hours: The guard hours all client contracts call for in the month, every post included. It has no target. It's the volume the other numbers are measured against, and it jumps in November and December when this firm's retail and warehouse clients add holiday posts.
- Guard Shift Fill Rate: Contracted hours with a guard on post, divided by contracted hours. Counted in hours, so a late arrival counts against it.
- Guard License Compliance: Active guards with a current state security license and their required training on file at month end, divided by active guards. Anything short of 100% is a list of names, and nobody on that list should be on the schedule.
- Guard Overtime % of Hours Worked: Overtime hours divided by all guard hours worked. Overtime here means hours past 40 in the workweek, the federal line, not hours past a scheduled shift.
- Monthly Guard Turnover Rate: Guards who left in the month divided by average guard headcount. Measured monthly, because at this firm's starting rate an annual figure lands above 100% and stops telling a manager anything.
- Guard Tour Compliance: Checkpoints scanned within their scheduled window divided by checkpoints scheduled. A scan 40 minutes late counts as a miss.
- Incident Reports Filed On Time: Incident reports delivered to the client within the contract's deadline, divided by reports filed. Most of this firm's contracts set the deadline at end of shift.
- Client Retention Rate: Contracts renewed in the last 12 months divided by contracts that came up for renewal in that time. Trailing, because one loss in a small month would swing it wildly.
- Contract Gross Margin: Contract billings less direct guard labor, meaning wages, the overtime premium and payroll burden, divided by billings. This firm's bill rates are fixed per contract, so overtime comes straight out of it.
In October 2024, Houston looks like the better-run branch. Its fill rate is 97.3% against Dallas's 95.2%, and 94.4% of its guards have a current license and training on file, against 93.8% in Dallas. Overtime is close, 12.5% in Houston and 13.8% in Dallas, and both lose about 9% of their guards every month.
December 2024 tests both. Holiday posts push company contracted hours to 97,510, overtime hits 15.6% at each branch, and license compliance drops to 92.9% at both as holiday hires reach posts before their files are complete. Gross margin is 19.4% in Dallas and 18.0% in Houston.
In April 2025, Dallas changes how it staffs. It hires a relief pool of 17 guards, taking headcount from 230 to 247, and trains each one on the post orders at several sites. Schedules go out two weeks ahead with fixed days off, and no guard is held over past 12 hours: after that, a relief guard takes the post. Houston keeps covering gaps the way it always has, by asking the off-going guard to stay. Its fill rate gives no reason to change.
The bill comes first. Dallas's gross margin falls from 20.0% in March to 17.8% in April 2025, below Houston's 18.6%, because the relief guards are paid while they learn the sites. License compliance dips too, to 91.9%, because 17 new hires arrive at once with training still to be filed. It's the month the owner came closest to reversing the decision. By September, Dallas's margin is back to 21.2%.
In July 2025, Dallas's fill rate passes Houston's for the first time, 97.3% to 97.0%. By October 2025, Dallas fills 98.7% of its hours and 97.4% of its guards are fully licensed and trained, because a relief guard can now cover a post while someone goes for fingerprints or a refresher class. Overtime is down to 6.0%, monthly turnover to 6.0%, guard tour compliance is 96.1% and 95.9% of incident reports reach the client on time.
Houston's fill rate that October is 97.5%. On its own, that's a fine number. Next to it, overtime is 15.9%, turnover 10.6%, license compliance 90.8%, tour compliance 84.4% and on-time incident reports 82.1%. Guards on their second shift in a row are missing checkpoints and finishing reports late, and the new hires replacing the leavers are reaching posts before their training is filed. By December 2025, Houston's overtime reaches 18.6%, tour compliance falls to 81.2% and license compliance to 87.6%: about one guard in eight is on the schedule without a complete file.
In February 2026, the board catches up with the client. A distribution center customer doesn't renew its two Houston sites, and its review cites gaps in the checkpoint log and late incident reports, not vacant posts. Houston's retention drops from 94.9% in January to 89.7%, then 87.2% by April. Its contracted hours fall from 44,409 in February to 42,280 in March.
Dallas has a miss of its own. In December 2025, the holiday posts outrun the relief pool: fill rate drops to 97.0% and overtime climbs back to 8.8%, from 6.7% in November. The pool was sized for an ordinary month, and December isn't one.
The company total hides most of this. Gross margin is 19.6% in October 2024 and 19.6% in September 2026. Split by branch, Dallas has gone from 20.0% to 21.9% and Houston from 19.2% to 16.6%. Houston started its own relief pool in July 2026, and its overtime is down from 16.0% that month to 13.8% by September, while license compliance has climbed from 89.8% to 91.3%, against 98.6% in Dallas. Houston's margin dipped to 15.2% in July, the same first-months cost Dallas paid. It's too early to say how far it will recover.
Creating a Security Firm Dashboard in SimpleKPI
-
Step 1 Define a filled post before you count one
Does a held-over guard count as filled? A supervisor standing post? A guard from another site who hasn't read this site's post orders? A guard who arrived 90 minutes late? Each branch will answer differently unless someone writes it down, and two branches counting differently can't be compared.
For a wider look at how to pick and define measures, see the guide to selecting KPIs.
-
Step 2 Take each number from the system that timestamps it
The scheduling system knows contracted and filled hours. The guard tour system knows when each checkpoint was scanned. The incident reporting app knows when a report was submitted, which you compare with the contract deadline. Payroll knows overtime, HR knows who left and whose license expires when, and finance knows billings and labor cost by contract. Supervisor estimates have no place here.
-
Step 3 Report by branch for managers and by client for account reviews
Branch managers need their own branch next to the other one, weekly, with fill rate, overtime and turnover together. Account managers need tour compliance and incident report timeliness for each client before every review. The owner needs gross margin by branch and by contract once the month closes. A contract that misses tour compliance three months running is a renewal at risk, whatever the branch figure says.
-
Step 4 Size relief cover for December, not for March
If your retail and warehouse clients add holiday posts, the extra hours land in the weeks guards most want off. Look at last year's November and December contracted hours, set a separate overtime ceiling for those months, and staff relief cover to meet it. A relief pool that's right for spring runs short in the peak, as this example's Dallas branch found.
List of Security Firm KPIs
We found no published US benchmark for contract guarding on any of these nine, so each target is a starting point. Reset them after twelve months of branch data.
| KPI Name | Typical Target | Description / Calculation |
|---|---|---|
| Contracted Guard Hours | No target (volume) | Guard hours called for by all client contracts in the month. |
| Guard Shift Fill Rate | ≥ 98% (starting point) | Contracted guard hours with a guard on post divided by contracted guard hours. |
| Guard License Compliance | 100% (starting point) | Active guards with a current state security license and required training on file, divided by active guards, at month end. In licensing states, 100% is the legal floor. |
| Guard Overtime % of Hours Worked | ≤ 8% (starting point) | Hours over 40 in a workweek divided by all guard hours worked. Lower is better. |
| Monthly Guard Turnover Rate | ≤ 6% (starting point) | Guards who left in the month divided by average guard headcount. Lower is better. |
| Guard Tour Compliance | ≥ 95% (starting point) | Checkpoints scanned within their scheduled window divided by checkpoints scheduled. |
| Incident Reports Filed On Time | ≥ 95% (starting point) | Incident reports delivered within the contract deadline divided by incident reports filed. |
| Client Retention Rate | ≥ 90% (starting point) | Contracts renewed in the last 12 months divided by contracts that came up for renewal in the last 12 months. |
| Contract Gross Margin | ≥ 22% (starting point) | Contract billings less wages, overtime premium and payroll burden, divided by contract billings. |
Why Security Firm Dashboards Matter
A guard company runs on promises made by the hour. The client bought coverage, rounds and reports, and checks them in its own logs. The firm sees schedules, payroll and invoices, usually in three systems and three different weeks. Read apart, the slow slide at one branch looks like a run of bad luck.
These KPIs pull on each other in ways a branch manager feels every week. Fill rate can be bought with overtime, and an overtime hour bills at the contract rate while it costs 50% more in wages. Overtime wears guards down, tired guards quit, and every guard who quits means another double shift for someone else, plus a new hire whose training file is still open on the day the schedule needs them. A relief pool breaks that loop, but it costs margin for months before it saves any, which is exactly when an owner looking only at the total would cancel it. That's why the staffing agency and HR dashboard examples are worth a look for guard firms too: in this business, the schedule is the product.
Proof of service lags the problems that cause it. Tour compliance and on-time reports fell at Houston for more than a year before the client left, and the client never once complained about an empty post. Retention is the last number to move, and by then the contract is gone.
Each month, put fill rate next to overtime, and turnover next to license and tour compliance. The distribution center that left Houston had a guard at its gate every night. What it didn't have was a full checkpoint log, and that was on the board months before the renewal letter.
Building it in SimpleKPI
Build this dashboard yourself with SimpleKPI's KPI dashboards. The mechanics are the same whatever you track:
- KPIs: each one gets a target, an entry frequency and tags, so you can report by team, site, product or whatever you split the numbers by.
- Data: type numbers in, import a spreadsheet, or use an integration or the API. The dashboard updates as each number lands, so daily and monthly KPIs sit side by side.
- Reports: scheduled KPI reports email the numbers to people who never log in.
- AI: Kip, the built-in AI, suggests targets and flags indicative benchmarks (AI estimates, not peer data) once some history builds up.
- Price: $79 a month for unlimited users and KPIs, as one flat price, with a 14-day free trial and no card needed.