The 15 best KPI software platforms and how to choose a KPI tool in 2026
Last updated July 2026.
Do you ever feel like you're just winging it in business, hoping for the best but not really sure if you're on the right track?
That's when you’re told by every business strategist and internet guru that Key Performance Indicators (KPIs) are your savior. But let's be honest, you’ve been trying to tame those KPIs with endless spreadsheets, and you’ve realized they are a fast track to a major headache.
The good news is that picking the right KPI software can seriously remove a lot of the pain.
So, choosing a dependable KPI software platform is essential for hitting those targets, and for reducing the pain of getting there.
If you're ready to get a clear view of what's what, you're in the right place! We're about to dive into the top 15 KPI software platforms businesses like yours should be looking at in 2026, and we'll walk you through how to pick the absolute best one for your needs.
Key takeaways
- SimpleKPI is the only flat-price pick in this list: $79/month (or $67/month billed annually) covers unlimited users, dashboards, reports, and KPIs, with its AI included at no extra cost.
- Tableau, Scoro, Perdoo, Hive, and Plecto charge per user, so cost climbs every time you add a teammate; Klipfolio and Geckoboard charge tiered rates that scale with dashboards and editors instead.
- Genuine free plans exist at Perdoo (up to 5 users), Hive (up to 10 users), Databox (1 user), and Cascade (a 2-user Planning tier), but none scale past a handful of seats.
- Enterprise BI platforms like Tableau, Qlik Sense, Sisense, GoodData, and Yellowfin suit complex, multi-source data modeling; most small and mid-sized teams only need a dedicated KPI dashboard tool, not a full BI stack.
- A simple KPI dashboard can be up and running in under an hour with most modern tools once you know which metrics matter most.
How We Evaluated These KPI Platforms for 2026
As the team behind SimpleKPI, we have spent almost twenty years building, testing, and refining performance dashboards. To create this 2026 guide, we analyzed over 40 different business intelligence tools and narrowed them down to the top 15 based on the following strict criteria:
- Ease of Setup: Can a non-technical manager connect their data and build a dashboard within an hour, or does it require a dedicated data scientist?
- Data Integrations: Does the platform offer native, real-time connections to the most common business tools (Stripe, Google Analytics, HubSpot, Salesforce)?
- Cost to Value Ratio: We recorded whether each vendor publishes a real price on its own site, and flagged the ones that do not rather than excluding them.
- Real-World Usage: We looked beyond feature lists to evaluate how these tools actually handle daily active usage, user permissions, and goal tracking based on direct industry experience.
Note: While we naturally believe SimpleKPI offers the best balance of power and simplicity for most teams, we have ensured this guide remains an objective, fact-based comparison of the entire market.
- Best 15 KPI Software Platforms
- At a Glance: KPI Software Platforms Compared
- What are the Key Features I Should Consider?
- How Do I Choose the Right Platform for Me?
- Why do companies use KPI Software
- Conclusion
- Free vs Paid KPI Software
- How KPI Software Pricing Works
- Frequently Asked Questions
Best 15 KPI Software Platforms
Ranked in no particular order, here are 15 of the best KPI Software Tools available.
#1 SimpleKPI: A Leader in KPI Software for 2026
Best for: Organizations that want KPI tracking running this week, with the depth to go further when they need it.
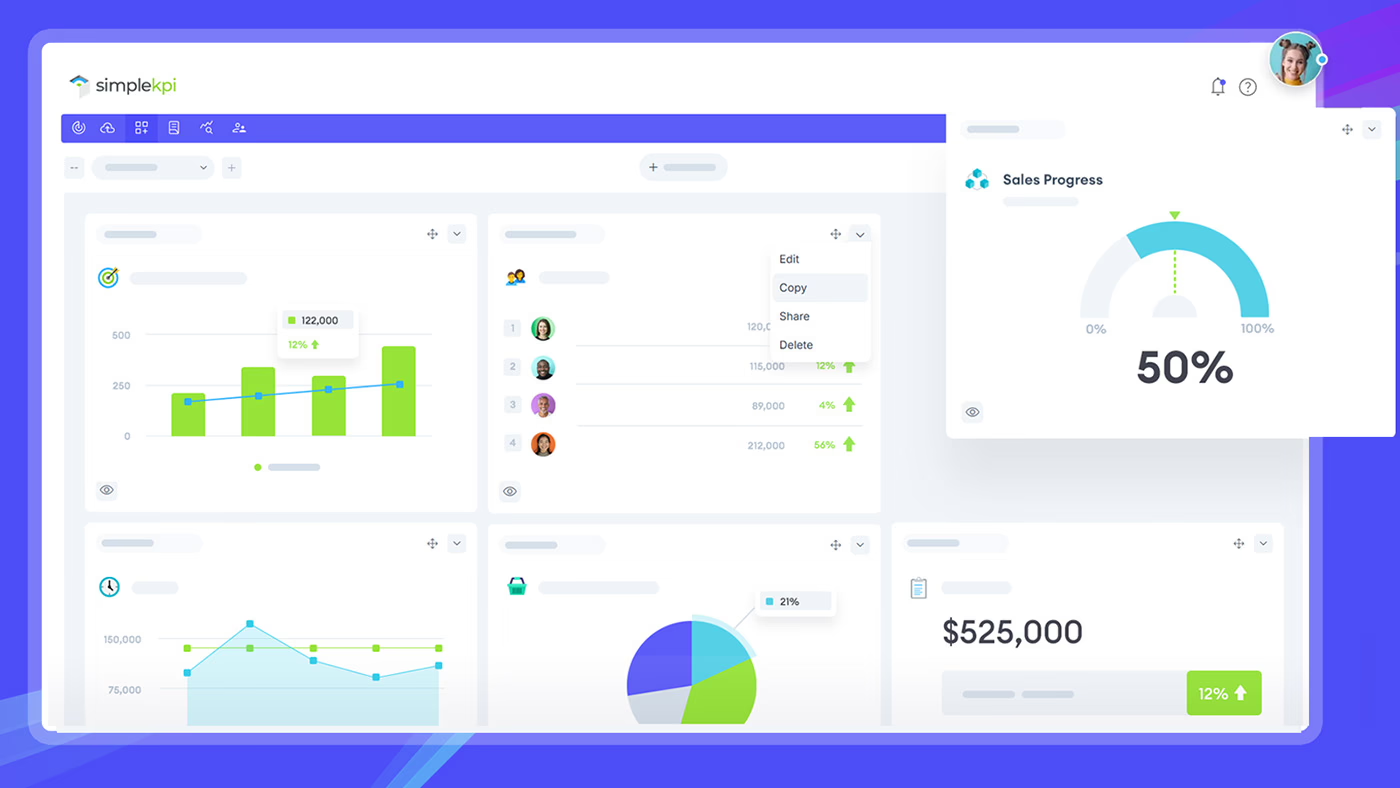
A quick disclosure: SimpleKPI is our product, so read this entry knowing that. We have scored it against the same twenty criteria as the other fourteen platforms here, and it does not win every row.
SimpleKPI has been building KPI software since 2007, and is used by organizations including G4S, the NHS, Brother and Merck. The idea behind it has not changed in almost twenty years: simple on the surface and quick to learn, with the depth of enterprise KPI software underneath when you need it.
Simple to set up, and simple to keep running
Most KPI projects die in the setup. SimpleKPI is built so the first dashboard exists before anyone loses interest: start from one of 50+ industry templates, import a spreadsheet and let AI map the columns, connect a data source, or type what you want in plain English and let Kip build it for you. There is no data modeling layer to learn and no consultant required.
It stays simple after week one, too. KPIs can be entered by hand, imported, or pushed through the API, and the people who own the numbers can update their own without going near a dashboard editor.
Kip: AI built into the core, with no credits to count
SimpleKPI's AI, called Kip, is part of the product rather than a metered add-on. Kip answers questions about your live KPI data, builds dashboards, suggests what a report should contain, and writes report summaries. Every change Kip proposes shows a confirmation step first, and Kip can never delete data.
The commercial point matters as much as the technical one. Of the fifteen platforms compared in the tables below, SimpleKPI is the only one that could be verified as including AI with no credit allowance, token cap or usage top-up. Several competitors ration AI by credits that reset monthly and do not roll over; several others publish no limit at all, which leaves you unable to find out what you are buying until you hit it.
Depth when you want to go further
The surface is deliberately simple. What sits under it is not:
- Structure: hierarchies, teams and departments, with role-based access for viewers, contributors, managers and analysts, so a director sees the whole organization and a team lead sees their own numbers.
- Calculated KPIs: build new KPIs from formulas over existing ones, and break the numbers down across teams, departments and hierarchy levels.
- Explore: trend verdicts, anomaly detection with tunable thresholds, root-cause analysis, forecasts, indicative AI-estimated industry benchmarks, and practical how-to-fix recommendations.
- Reports: a report builder with six section types, scheduled email delivery, PDF export, and a live share link that needs no login.
- KPI Score: a single 0-100 health score on the Home screen for a fast read on the whole business.
That combination is the reason SimpleKPI is not only a small-team tool. The same flat price covers a five-person team and a multi-department organization with an analyst function, because users, dashboards, reports and KPI history are all unlimited.
SimpleKPI's features include:
- KPI Dashboards
- KPI Reports
- KPI Insights (Pulse and Explore)
- Kip, AI built into the core
- Every KPI tool in one product
- Integrations / Zapier / Developer API
- Custom built and calculated KPIs
- Manual entry / Excel spreadsheet / Google Sheets
- User management, roles and hierarchies
Pricing Plan
$79 per month, or $67 per month when billed annually at $804 a year. One flat price for the whole organization, with unlimited users, dashboards, reports, KPIs and history, and every AI feature included with no credits to track. See the full pricing page.
Downsides
Alerting is in-app only. Pulse flags anomalies and threshold breaches as they happen, but it will not push them to Slack, Teams or email yet, so someone has to open the app to see them.
#2 Tableau
Best for: Enterprise data and BI teams.
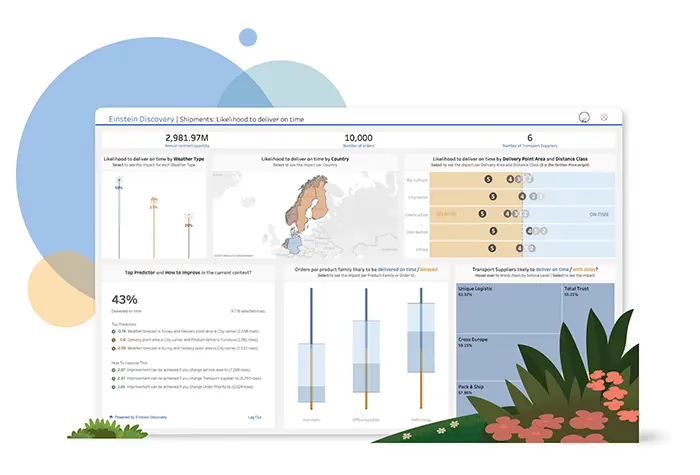
Tableau is an established and popular data visualization tool that has transformed the data analysis and business intelligence domains. Its versatile and user-friendly platform enables data analysts to create interactive and insightful visualizations that enable decision-makers to make informed decisions based on data-driven insights.
One of Tableau's key features is its ability to handle large volumes of data with unprecedented speed and efficiency. It can work with different data types, including text, numbers, and geographic information, and integrate them smoothly to analyze the data comprehensively. Tableau also supports data blending, which allows analysts to combine data from multiple sources and create custom relationships between them.
Tableau's features include:
- Dashboards
- Report Subscriptions (PDF/email)
- Integrations
- Team Collaboration
- AI Data Explanations
Downsides
High learning curve for beginners; also comes with a relatively higher cost per user, which can impact smaller budgets.
Pricing Plan
$15 - $75 per user per month, depending on the plan.
#3 Yellowfin
Best for: Software vendors embedding white-label analytics.
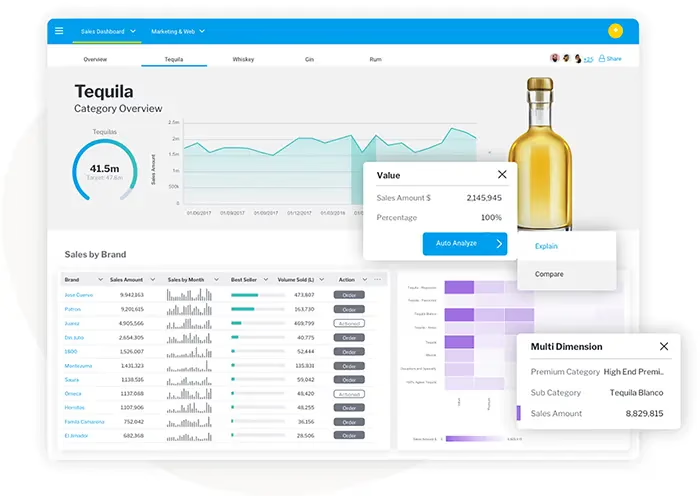
Yellowfin is an established analytics and business intelligence (ABI) vendor, in business since 2003, offering a suite of BI and embedded-analytics products including automated business monitoring via Yellowfin Signals. It boasts a vast user base of over 3 million end-users across 75 countries and more than 29,000 organizations that rely on its platform daily. The company has garnered significant recognition from the world's leading analyst firms for its innovative approach to BI.
What sets Yellowfin apart from other analytics providers is its focus on the builders, designers, developers, data scientists, and DevOps teams who embed data solutions into business applications and workflows. The platform delivers KPI analytics in multiple formats, helping decision-makers see, understand, and act on their data.
Yellowfin features include:
- Data Science Integration
- Meta-Data Modeling
- Reporting
- Data Visualization
- Dashboards
- Signals
- Assisted Discovery
- Automated KPI monitoring
Downsides
Fewer native no-code integrations than lightweight dashboard tools, and it's built for embedding by developer and data teams rather than plug-and-play setup.
Pricing Plan
Custom, quote-based pricing. Yellowfin does not publish per-user rates; contact sales for a quote.
#4 Klipfolio
Best for: Teams avoiding per-seat dashboard fees.
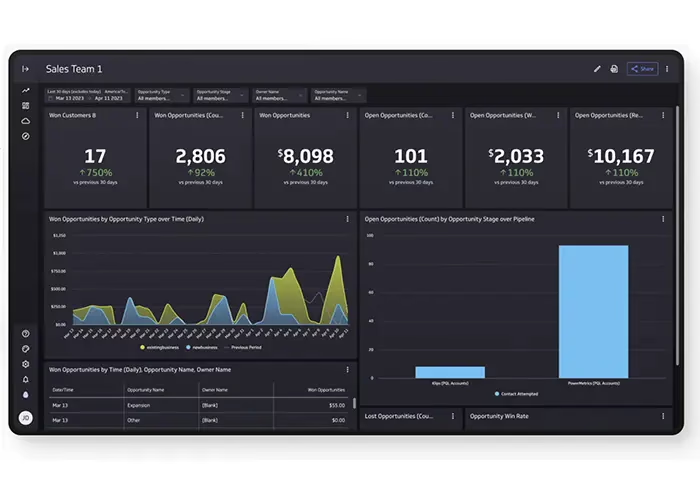
Klipfolio is an exceptional online dashboard platform that helps users create real-time dashboards quickly. Klipfolio's intuitive interface and powerful features enable users to monitor critical metrics and KPIs in a fraction of the time other platforms require. The platform has captured a significant market share owing to its exceptional ease of use, cost-effectiveness, and flexibility.
Moreover, the platform offers smooth integration with various marketing, sales, accounting, and IT applications, making it the go-to dashboard platform for multiple industries.
Additionally, Klipfolio's wide range of dashboard templates, widgets, and data sources enables users to personalize their KPI dashboards and gain greater control over their data visualization. By using Klipfolio's powerful analytics capabilities, organizations of all sizes can make data-driven decisions, automate critical processes, and stay ahead of the competition.
Klipfolio features include:
- KPI Dashboards
- Reporting
- Integrations
- Metric & Target Tracking
- Collaboration and sharing
Downsides
Can get expensive as your dashboard count or refresh-rate needs grow, and only the top tier gets up-to-the-minute data; entry plans refresh every 4 hours, rising to every 15 minutes on mid tiers.
Pricing Plan
$120 to $600 a month, billed annually, with unlimited users on every plan.
If Klipfolio is on your shortlist, SimpleKPI vs Klipfolio sets the two out feature by feature and prices both at 5, 25 and 100 people.
#5 Gooddata
Best for: Enterprise teams needing embeddable BI.
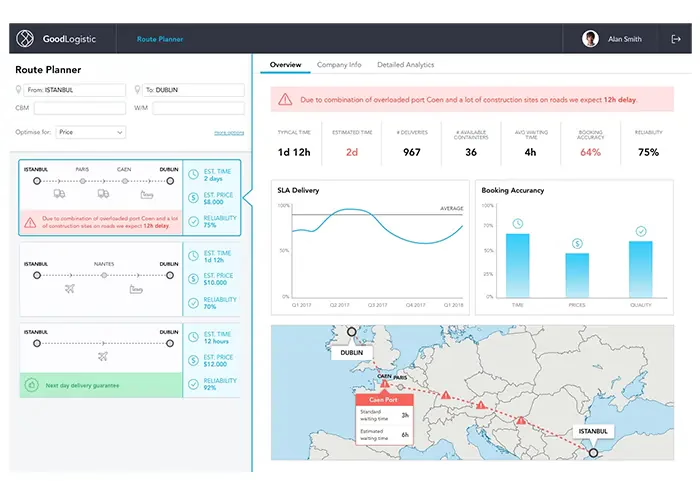
GoodData is a business intelligence and embedded-analytics platform that has repositioned around AI and agentic features, helping businesses centralize their data management and analysis. GoodData enables users to track and analyze performance metrics and KPIs across multiple data sources.
What sets GoodData apart is its governed semantic layer and AI agent features, built for enterprise and ISV teams running embedded analytics rather than a beginner-first dashboard tool.
GoodData features include:
- Reports Interface
- Data Visualizations
- Data Modeling
- Data Filtering
- Dashboards
- Notifications
- KPI Reporting
Downsides
High starting cost may deter small businesses, and the platform’s customization requires technical expertise.
Pricing Plan
Custom, quote-based pricing. GoodData no longer publishes a starting price; the Professional tier is billed as a platform fee plus a per-workspace fee, confirmed only via sales.
#6 Scoro
Best for: Agencies wanting an all-in-one PSA platform.
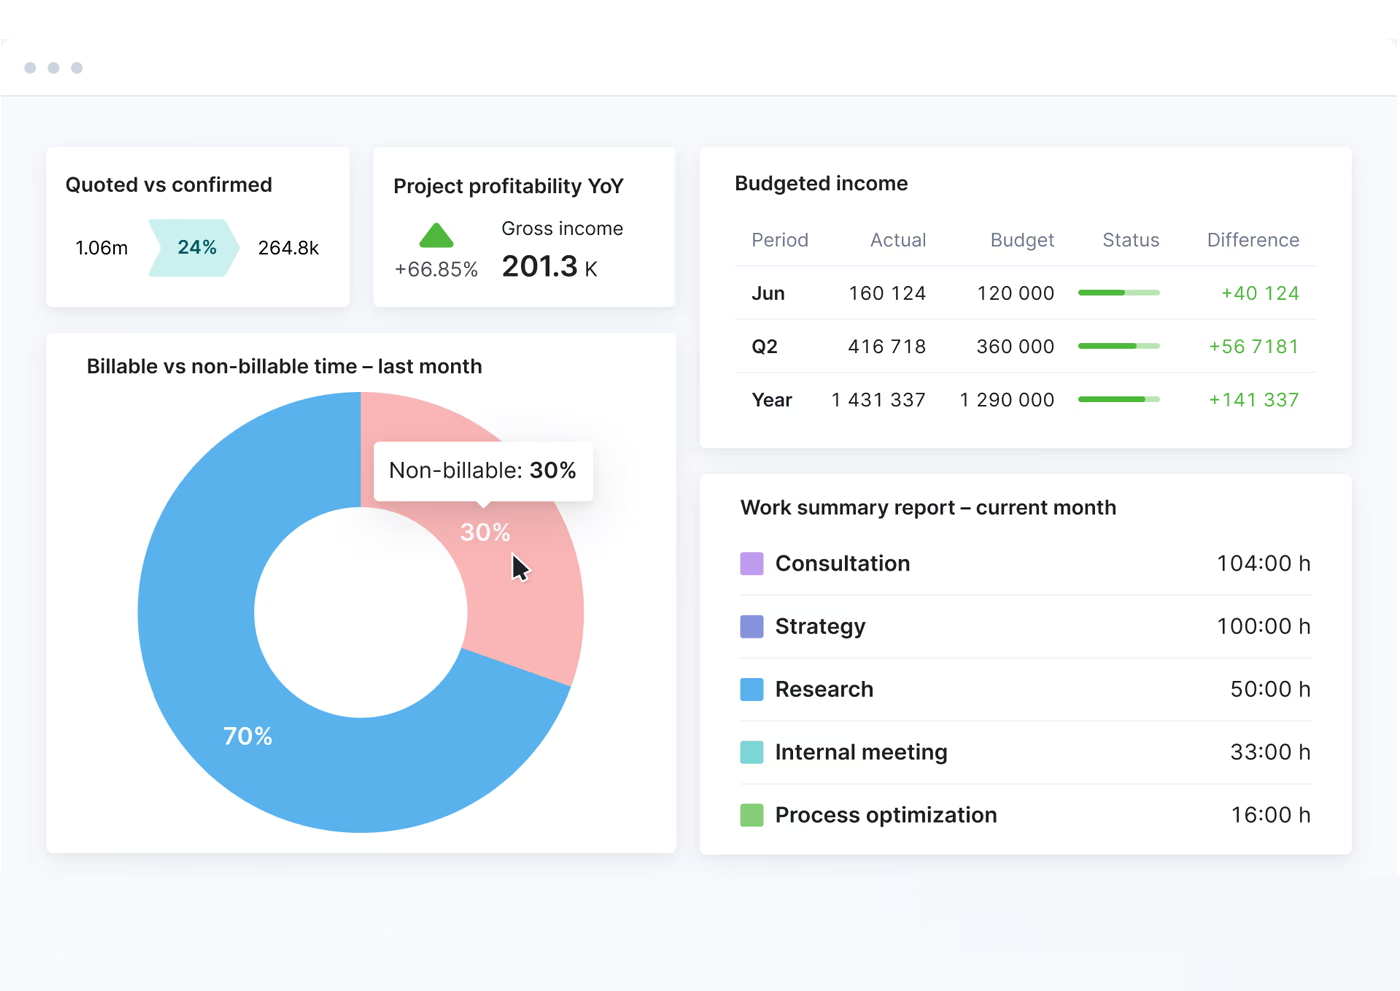
Scoro is an end-to-end business management platform that features a highly capable, built-in KPI dashboard system. Unlike standalone visualization tools that require you to pipe data in from external sources, Scoro is designed for teams who want to manage their projects, billing, and resources in the same place they track their metrics.
Scoro features include:
- Built-in CRM & Projects
- Role-based Dashboards
- Financial & Team KPIs
- Real-time Reporting
- Actionable Insights
- Goal Tracking
Downsides
Overkill if you only need a standalone dashboard, and its native integration library is smaller than a dedicated BI tool's, though Zapier fills some gaps.
Pricing Plan
Starts at $19.90 per user/month (5-user minimum; $18.90/user/month billed annually).
#7 Perdoo
Best for: Teams unifying OKRs with people management.
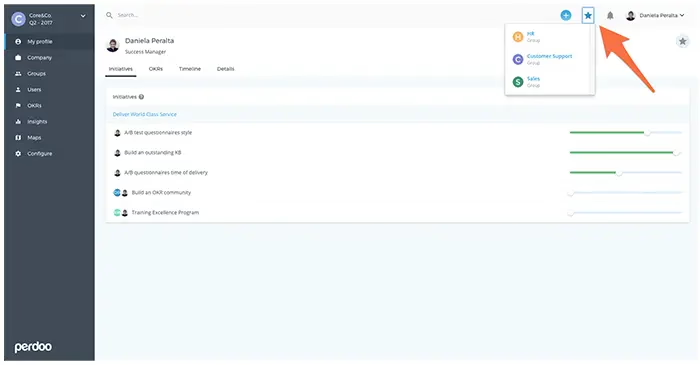
Perdoo is an OKR and strategy-execution platform that also tracks KPIs. It brings strategy, goal, and people management together in one place. Perdoo is built around the Objectives and Key Results (OKR) framework to implement and execute your company's strategy quickly.
Perdoo has helped countless organizations reach their full potential with a user-friendly interface and comprehensive features. Plus, with increased semantic richness and more detailed information, you can be confident that you're getting the best tool for your business needs.
Perdoo features include:
- OKR and KPI Management
- Dashboards
- Goal Settings and Tracking
- Team Management and Collaboration
Downsides
Geared toward OKR tracking, which may not suit all businesses; its free plan has limited features and users.
Pricing Plan
Free for up to 5 users. Premium and Supreme plans from $9 - $11 per user/month (volume discounts apply, 5-seat minimum).
#8 Hive
Best for: Teams wanting project management plus dashboards.
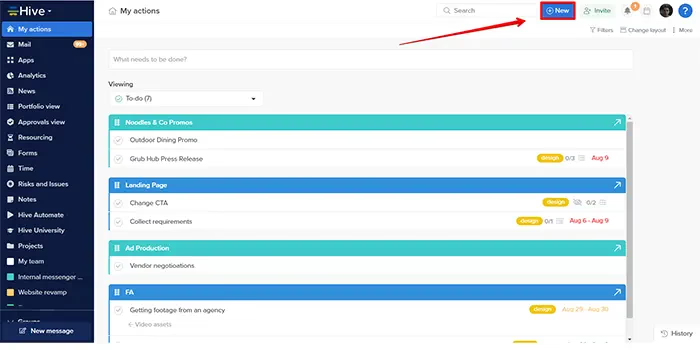
If you're in search of a project management and collaboration platform with built-in dashboards and goal tracking, look no further than Hive. This latest product version offers a range of features that make it a top choice for businesses of all sizes.
One of the features of Hive is its Goals dashboard. This dashboard gives users an overview of their organization's performance in various areas and lets them drill down into specific metrics to see where they need to improve.
Hive features include:
- Goals
- Time Tracking
- Collaboration
- Analytics
- Dashboards
- Buzz AI (paid add-on)
Downsides
Primarily built for project management; lacks the full analytical depth some KPI-specific tools offer.
Pricing Plan
A limited free plan covers up to ten workspace members. Paid plans start at $5 per user per month on Starter (billed annually), with the main Teams tier at $12 per user per month billed annually, or $18 billed monthly. Buzz AI is a paid add-on rather than part of the base plans.
#9 Geckoboard
Best for: Small teams wanting simple TV dashboards.
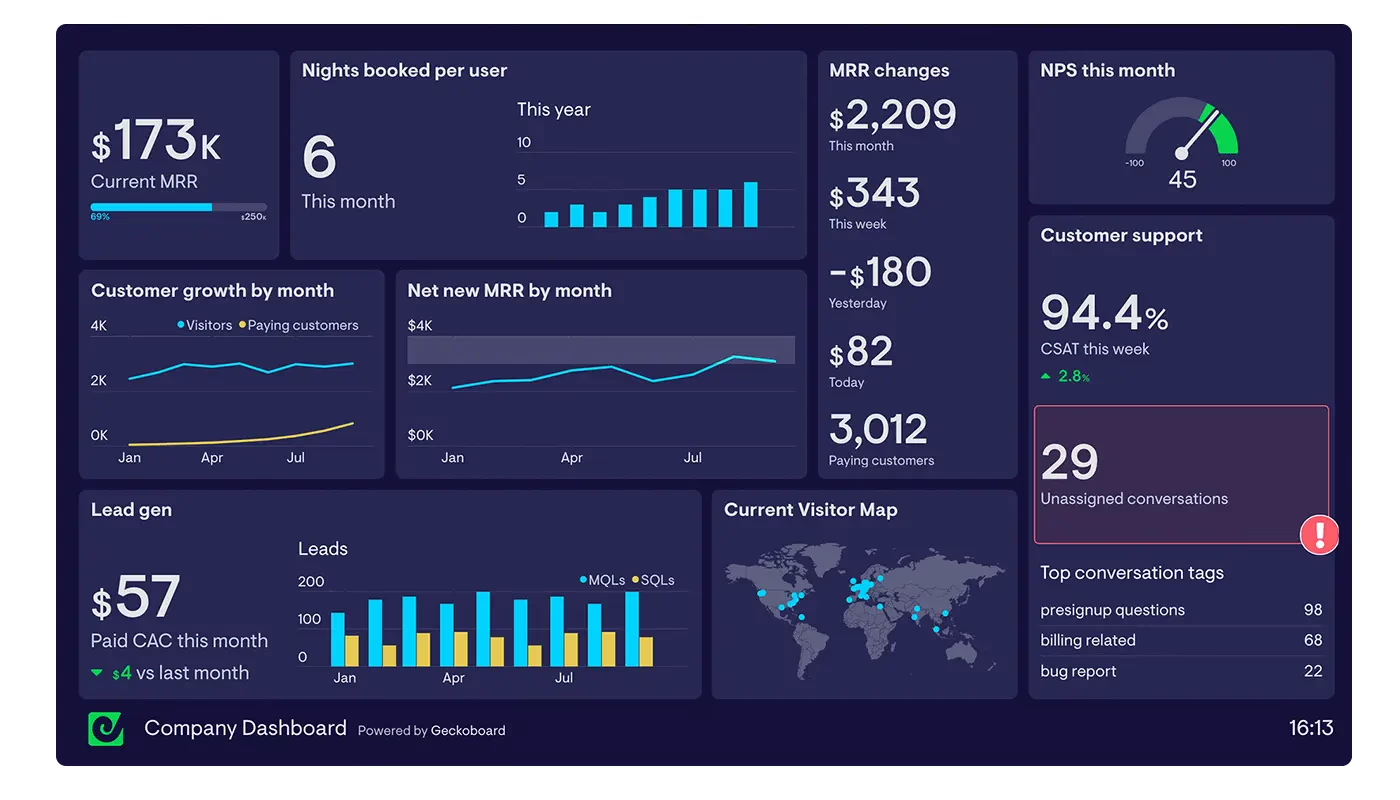
Geckoboard is a powerful KPI software tool that enables businesses to monitor their metrics on a real-time basis. This tool is designed to help enterprises to keep track of their performance against set targets, make informed decisions, and eventually achieve their goals. Geckoboard has become synonymous with simplicity, increased visibility, and actionable insights.
From a user perspective, Geckoboard integrates with more than 90 different channels, including Google Analytics, Salesforce, Zendesk, and HubSpot, making it one of the most versatile KPI software tools on the market. The tool provides a range of different data visualizations, including line graphs, bar charts, and funnel visuals, all of which can be customized to fit a specific organization's style and needs.
Geckoboard features include:
- KPI Dashboard
- Data Integrations
- Dashboard Examples
- TV Ready
Downsides
Built for simple, real-time dashboard display rather than deep data analysis; teams needing BI-style drill-down should look elsewhere.
Pricing Plan
$79 per month (Essentials, billed annually) up to $319 per month (Performance, billed annually); custom Enterprise pricing above that.
There is a fuller head to head in SimpleKPI vs Geckoboard, including where each one wins and what the two cost side by side.
#10 Databox
Best for: Marketing teams blending many data sources.
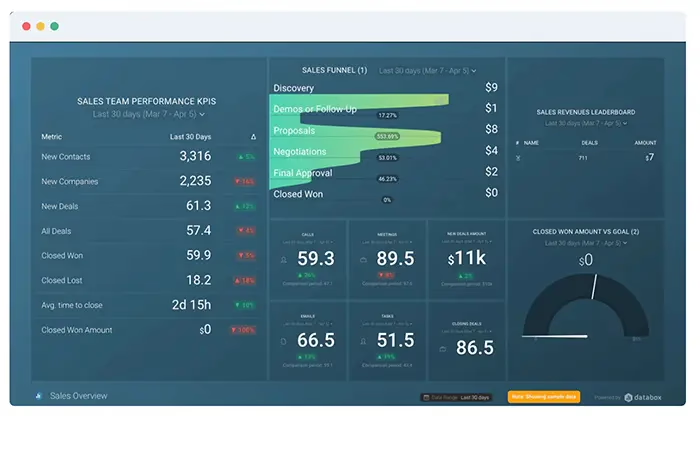
With Databox, you can easily set up custom dashboards and reports that give you a real-time view of your website traffic, engagement rates, and conversion metrics. Databox makes it easy to monitor your performance, spot trends, and make data-driven decisions, whether you're a small business owner looking to optimize your online presence or a marketing team leader tasked with improving ROI.
One of the benefits of Databox is its flexibility and ease of use. You'll find the platform intuitive and user-friendly, whether you're a beginner or an experienced marketer. Plus, with a wide range of integrations available (including tools like Google Analytics, HubSpot, and Facebook Ads), you can pull data from all your favorite sources and get a holistic view of your digital performance.
Databox features include:
- Reports
- Dashboards
- Scorecards
- Custom Metric Builder
Downsides
Best suited to teams centralizing data from many external tools rather than doing deep, from-scratch data modeling; for that, a full BI platform may still be a better fit.
Pricing Plan
Plans start at $64 per month for a single user, or $159 per month (billed annually) for unlimited users; Databox prices by data sources connected, not by seat.
We go through this one properly in SimpleKPI vs Databox, feature by feature, with what each costs at 5, 25 and 100 people.
#11 Sisense
Best for: Engineering teams embedding white-label analytics.
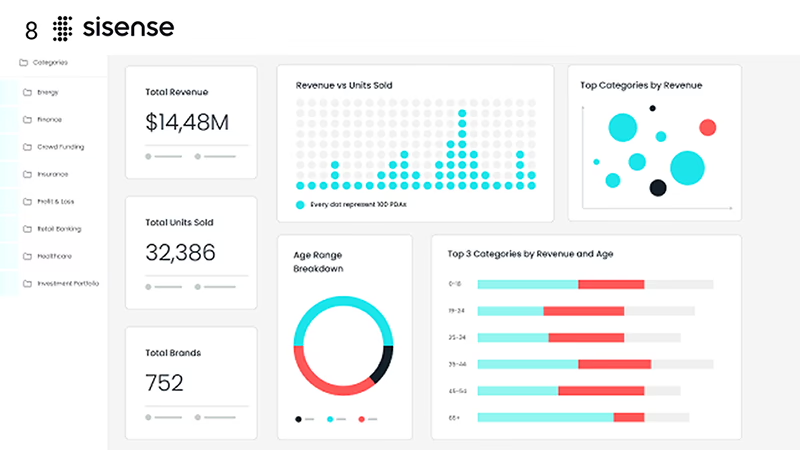
Sisense is a business intelligence platform built for organizations whose data needs have outgrown a standalone dashboard tool. A two-decade-old BI platform, it now serves more than 2,000 enterprise clients, including Nasdaq and Philips, who rely on it to pull data from hundreds of sources and model it however their business requires.
What sets Sisense apart is embedding. Instead of living as a separate reporting tool, it lets you build white-label analytics directly into your own SaaS product or customer portal, so end users see KPI cards and charts as a native part of your app rather than a bolt-on dashboard.
Sisense's features include:
- Embedded, white-label analytics
- Multi-source data modeling
- AI-powered insights
- Dashboards and KPI cards
- Flexible deployment and security controls
Downsides
The full platform, and especially its Enterprise tier, still involves more setup and depth than a business that just wants a simple KPI dashboard needs.
Pricing Plan
The Self-Serve plan starts with a free 7-day trial and in-app signup, with pricing disclosed at checkout. The Enterprise plan is custom, quote-based; you'll need to contact Sisense's sales team for a number.
#12 Plecto
Best for: Sales teams wanting gamified dashboards.
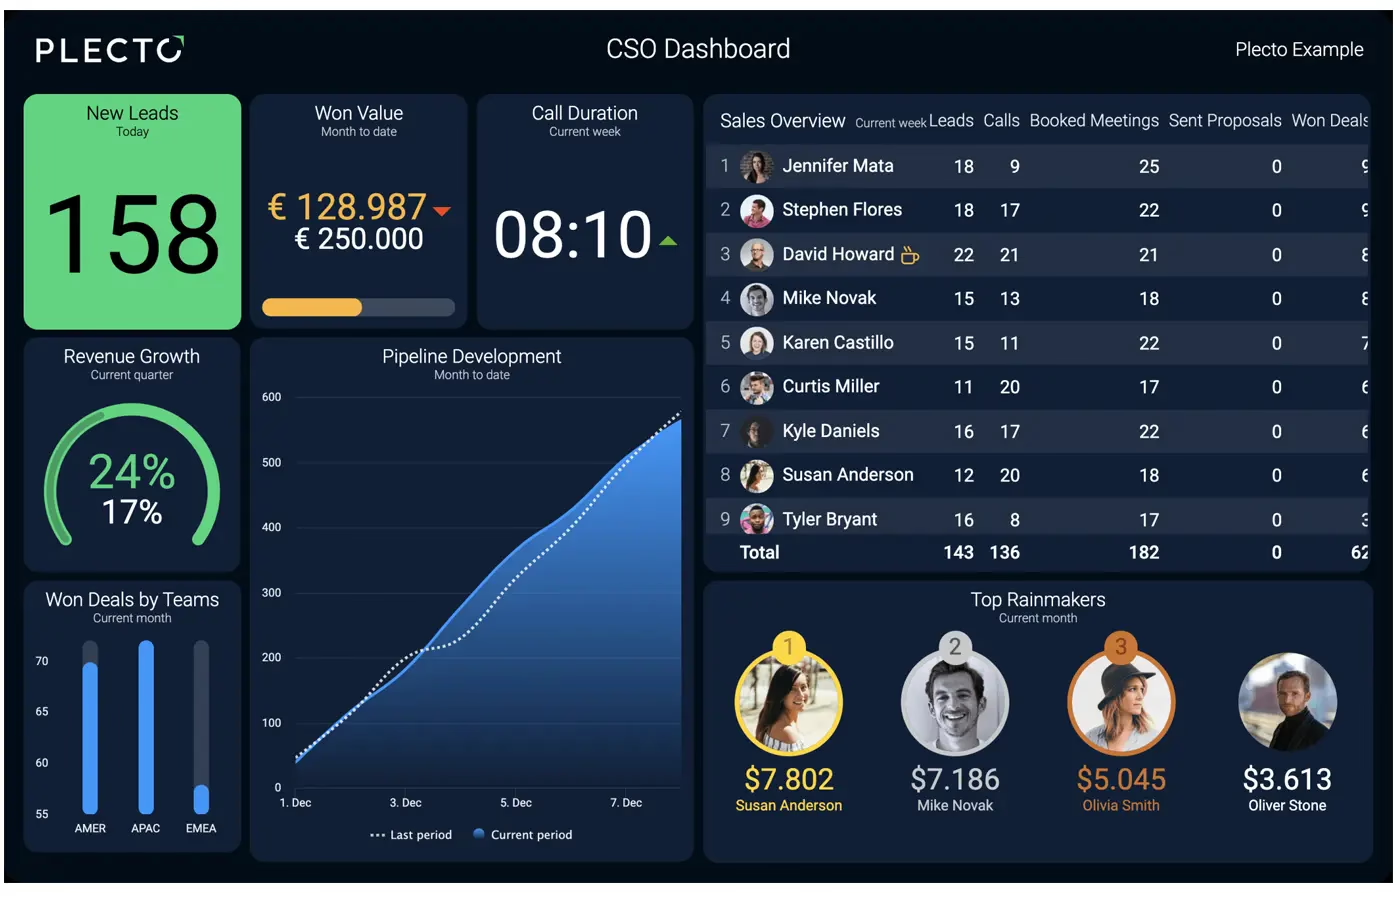
Are you looking for a powerful and fun solution to help your team stay motivated and productive? Look no further than Plecto! This innovative platform is designed to provide real-time data insights and engaging visualizations that help your team stay on top of their goals and perform at their best.
With Plecto, you can easily track your team's progress and KPIs in an informative and engaging way. Plecto is the perfect tool for the job, whether you're visualizing your sales numbers, tracking your support tickets, or keeping tabs on employee performance.
And with real-time data updates and mobile access, you can stay on top of your team's progress no matter where you are.
Plecto features include:
- Coaching & Training (paid add-on)
- Gamification
- Dashboards
- Reports (Large plan+)
Downsides
Pricey compared to competitors; focuses on gamification, which may not appeal to all users.
Pricing Plan
$300 per month (billed yearly) for 10 tracked licenses, or $465 per month (billed yearly) for the Large plan including Reports and SQL Integrations.
Because Plecto bills per tracked license, the gap widens with every person you add. SimpleKPI vs Plecto works that through at 5, 25 and 100.
#13 Qlik Sense
Best for: Enterprise BI teams with complex data.
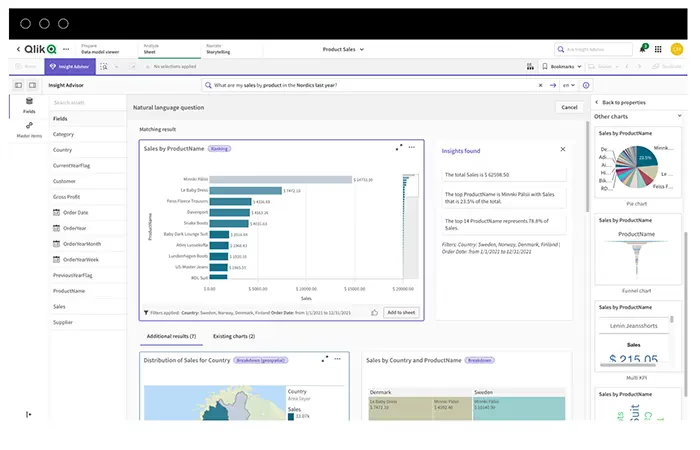
Introducing the Key Performance Indicators (KPI) capabilities of Qlik Sense. This business intelligence tool utilizes data-driven insights to monitor your organization's performance. You can easily track and measure your KPI goals and objectives through the platform's advanced data visualization and dashboards, enabling quick decision-making and driving optimal business outcomes.
Qlik Sense helps you gain a deeper understanding of your organization's performance, enabling you to identify trends, uncover hidden insights, and monitor the overall health of your business. With Qlik Sense's KPI capabilities, you can enhance your business strategy and accelerate growth by ensuring your initiatives align with your goals.
Qlik Sense features include:
- Self-service Visualization
- Interactive Dashboards
- Reporting
- Alerting and Actions
- Custom Embedding
Downsides
Built for BI and data teams; the associative engine and capacity-based licensing mean more setup and training than a plug-and-play SMB KPI tool.
Pricing Plan
Qlik now prices by data capacity rather than per seat. Plans start from $300 per month; see Qlik's pricing page for details.
#14 Cascade
Best for: Enterprises running formal strategic planning.
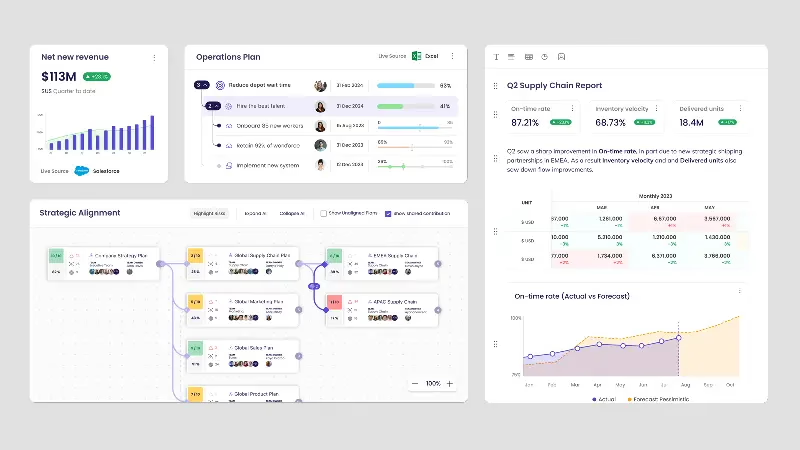
Cascade is a strategy execution platform with built-in KPI and metrics tracking that helps businesses track their progress toward achieving their company goals. It offers a unified approach to KPI tracking, reporting, and planning.
Cascade's features include:
-
Track KPIs:
Cascade allows you to track your Key Performance Indicators (KPIs) in sync with your business goals. You can measure and monitor specific metrics businesses use to evaluate their progress toward achieving their organizations' goals.
-
Collaborate:
Cascade allows teams to collaborate on projects without the endless email threads and check-ins. You can align with many strategies and execute more of the right work faster.
Downsides
Designed primarily for strategic planning, which may limit appeal for companies focused purely on KPI tracking.
Pricing Plan
You will need to discuss your requirements with Cascade's sales team to obtain pricing for the paid Essentials and Enterprise tiers. A free Planning tier is also available for up to 2 users, with no sales contact required.
#15 KPI Fire
Best for: Teams running Lean Six Sigma programs.
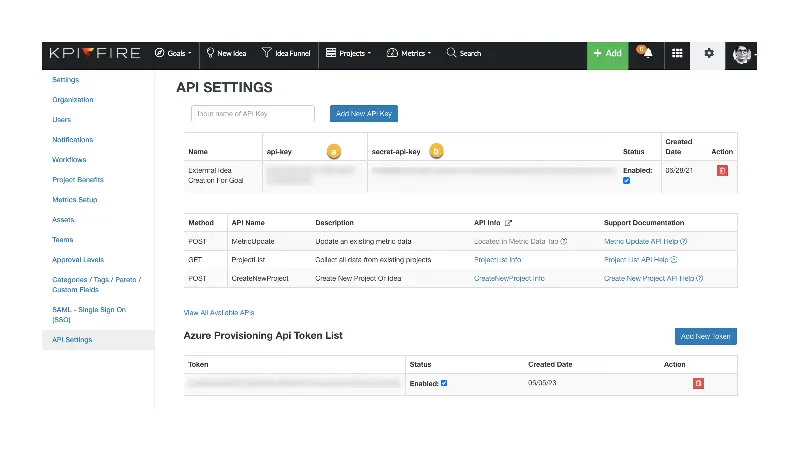
KPI Fire's strategy execution KPI software helps businesses achieve their strategic goals by aligning their improvement projects with their KPIs. This software provides a unified KPI tracking, reporting, and planning approach. With KPI Fire, you can track your Key Performance Indicators (KPIs) in sync with your business goals, measure and monitor specific metrics that businesses use to evaluate their progress toward achieving their company goals and quantify the performance of your business improvement program.
KPI Fire's features include:
-
Collaboration:
KPI Fire helps teams collaborate on cross-functional projects without the endless email threads and check-ins. You can align with one or many strategies and execute more of the right work, faster.
-
Centralized observability:
KPI Fire links metrics, initiatives, and outcomes, providing context to interpret your KPIs effectively.
-
Quantify performance:
KPI Fire helps you quantify the performance of your business improvement program. Lean, Six Sigma, Balanced Scorecard, and Continuous Improvement are all supported.
-
Project and Portfolio Management:
KPI Fire provides a single source of information for your continuous improvement program idea funnel and projects. It also includes special tools for tracking project impact and financial benefit.
Downsides
Integration options are narrower than large BI platforms such as Tableau or Power BI, and its pricing is not transparent without a demo.
Pricing Plan
KPI Fire publishes no pricing. You can start a 30-day free trial without a card, but a figure only comes from a sales conversation.
At a Glance, KPI Software platforms compared
Prices checked July 2026 on each vendor's pricing page.
| Tool | Best for | Starting price | Free trial | Standout feature | Main limitation |
|---|---|---|---|---|---|
| SimpleKPI | Teams and organizations wanting flat-fee simplicity with depth | $79/mo | 14-day trial | One flat price, unlimited users | No free forever plan, 14-day trial only |
| Tableau | Enterprise data and BI teams | $15-$75/user | 14-day trial | Tableau Pulse AI insights | Steep learning curve, pricier per seat |
| Yellowfin | Software vendors embedding white-label analytics | Quote-based | 30-day trial (request form) | Signals automated anomaly detection | Built for developers, not plug-and-play |
| Klipfolio | Teams avoiding per-seat dashboard fees | $120/mo | 14-day trial | 130+ data source integrations | Entry plan refreshes only every 4 hours |
| GoodData | Enterprise teams needing embeddable BI | Quote-based | No, demo only | Built-in AI Assistant and agents | No published pricing, needs technical expertise |
| Scoro | Agencies wanting an all-in-one PSA platform | $19.90/mo/user | 14-day trial | ELI AI assistant built in | 5-user minimum on every plan |
| Perdoo | Teams unifying OKRs with people management | Free, then $9/user | No (free tier instead) | AI Coach on every plan | Free plan capped at 5 users |
| Hive | Teams wanting project management plus dashboards | Free, then $5/user | 14-day trial | Goals dashboard with drill-down | Buzz AI is a paid add-on |
| Geckoboard | Small teams wanting simple TV dashboards | $79/mo | 14-day trial | 90+ integrations, TV-ready display | No deep BI drill-down |
| Databox | Marketing teams blending many data sources | $64/mo | 14-day trial | AI-generated performance summaries | Not built for deep data modeling |
| Sisense | Engineering teams embedding white-label analytics | Quote-based | 7-day trial (Self-Serve) | Embedded white-label analytics | More setup than a simple dashboard needs |
| Plecto | Sales teams wanting gamified dashboards | $300/mo | 14-day trial | Gamified contests and leaderboards | Reports need the pricier Large plan |
| Qlik Sense | Enterprise BI teams with complex data | $300/mo | 30-day trial | Qlik Answers GenAI assistant | Entry plan capped at 10GB of data |
| Cascade | Enterprises running formal strategic planning | Free tier / Quote-based | 14-day trial | Tapestry AI strategy assistant | Paid tiers require a sales quote |
| KPI Fire | Teams running Lean Six Sigma programs | Quote-based | 30-day trial | Idea funnel and savings tracking | No pricing without booking a demo |
Feature by feature, verified against each vendor's own site
The table above is the short answer. This one is the long answer: twenty capabilities checked against all fifteen platforms in this guide's published pricing, feature pages and documentation on 26 July 2026. SimpleKPI does not win every column: its threshold alerts are in-app only, and its native integration count is well below the biggest platforms. Both show in the tables below.
How to read these tables. Every competitor cell was taken from that vendor's own pricing page, feature pages or documentation and verified on 26 July 2026. "n/p" means the vendor does not publish it; it is not a No. SimpleKPI is the first row and does not win every column.
| Platform | Benchmarking | Calculated KPIs | Breakdowns | Targets, RAG | Templates |
|---|---|---|---|---|---|
| SimpleKPI | Indicative | Yes | Yes | Yes | Yes |
| Databox | No | Yes | Yes | Yes | Yes |
| Klipfolio | Partial | Yes | Yes | Yes | Yes |
| Geckoboard | No | Partial | Yes | Yes | Yes |
| Plecto | No | Yes | Yes | Yes | Yes |
| Scoro | No | Yes | Yes | Yes | Yes |
| Cascade | n/p | Partial | Partial | Yes | Yes |
| Perdoo | No | Partial | Partial | Yes | Yes |
| KPI Fire | n/p | Yes | Yes | Yes | Yes |
| Hive | n/p | Partial | Yes | Yes | Yes |
| Tableau | Partial | Yes | Yes | Yes | Yes |
| Qlik Sense | n/p | Yes | Yes | Yes | Yes |
| Sisense | n/p | Yes | Yes | Partial | Partial |
| GoodData | Partial | Yes | Yes | Partial | n/p |
| Yellowfin | n/p | Yes | Yes | Yes | Partial |
| Platform | AI included | AI not metered | Root cause | Forecasting | Anomaly detection |
|---|---|---|---|---|---|
| SimpleKPI | Yes | Yes | Yes | Yes | Yes |
| Databox | Yes | No | Partial | Partial | Yes |
| Klipfolio | Yes | n/p | Yes | Add-on | Add-on |
| Geckoboard | Partial | n/p | Partial | No | No |
| Plecto | Yes | n/p | No | Partial | No |
| Scoro | Yes | No | Partial | Partial | Partial |
| Cascade | Yes | n/p | Yes | n/p | Partial |
| Perdoo | Yes | No | Partial | No | No |
| KPI Fire | Partial | n/p | Partial | Yes | Yes |
| Hive | Add-on | No | n/p | Add-on | n/p |
| Tableau | Partial | n/p | Yes | Yes | Yes |
| Qlik Sense | Yes | No | Partial | Yes | Yes |
| Sisense | Yes | No | Yes | Yes | Yes |
| GoodData | Partial | No | Partial | Partial | Partial |
| Yellowfin | Add-on | No | Yes | Yes | Partial |
| Platform | Entry price | Flat price | Unlimited users | Native integrations | Trial, no card |
|---|---|---|---|---|---|
| SimpleKPI | $79/mo flat | Yes | Yes | 6 + Zapier | Yes |
| Databox | $64/mo (1 user) | Partial | No | 130+ | Yes |
| Klipfolio | $120/mo | Yes | Yes | 130+ | Yes |
| Geckoboard | $79/mo | No | Partial | 90+ | Yes |
| Plecto | $300/mo | No | Partial | 150+ | Yes |
| Scoro | $19.90/user | No | No | n/p | Yes |
| Cascade | n/p | n/p | Partial | n/p | Yes |
| Perdoo | $9/user | No | No | n/p | Partial |
| KPI Fire | n/p | No | Partial | n/p | Yes |
| Hive | $5/user | No | No | n/p | Yes |
| Tableau | $15-$75/user | No | No | n/p | Yes |
| Qlik Sense | $300/mo | No | Partial | n/p | Yes |
| Sisense | n/p | No | n/p | 200+ | Yes |
| GoodData | n/p | No | Yes | n/p | n/p |
| Yellowfin | n/p | No | n/p | 200+ | Partial |
| Platform | Threshold alerts | Scheduled email | Public link | Roles | API |
|---|---|---|---|---|---|
| SimpleKPI | In-app | Yes | Yes | Yes | Yes |
| Databox | Yes | Yes | Yes | Yes | Yes |
| Klipfolio | Partial | Yes | Yes | Yes | Yes |
| Geckoboard | Yes | Yes | Yes | Yes | Yes |
| Plecto | Yes | Partial | Yes | Partial | Yes |
| Scoro | Yes | Partial | Partial | Yes | Yes |
| Cascade | No | Yes | No | Yes | Partial |
| Perdoo | No | Yes | No | Yes | Yes |
| KPI Fire | Yes | Yes | n/p | Yes | Yes |
| Hive | Partial | Yes | No | Yes | Yes |
| Tableau | Yes | Yes | No | Yes | Yes |
| Qlik Sense | Yes | Yes | Partial | Yes | Yes |
| Sisense | Yes | Yes | Partial | Yes | Yes |
| GoodData | Yes | Yes | No | Yes | Yes |
| Yellowfin | Yes | Yes | Partial | Yes | Yes |
What are the key KPI Software features you should consider?
When it comes to selecting KPI software, companies are often presented with an overwhelming number of choices. However, for most businesses, only five critical features must be considered.

-
KPI Dashboards
First up: KPI dashboards. These dashboards provide a real-time snapshot of all the relevant KPIs in a single view, making it easy to identify trends and issues quickly. Plus, they're customizable based on a user's specific needs and preferences. Imagine being able to make informed business decisions at a glance instead of scouring through reams of data.
-
KPI Reports
Next, KPI reports provide in-depth analysis and insights. With KPI reports, users can drill down into the data to uncover patterns and trends that may be hidden in the raw data. These reports also make it easy to share key insights with stakeholders, such as investors or senior leadership. And much like dashboards, these reports are customizable and can be generated in various formats to meet the needs of different audiences.
-
Sharing and Collaboration
Speaking of sharing, the ability to share KPI dashboards is another critical feature. Collaboration is essential in today's work environment, and sharing dashboards and reports with multiple stakeholders makes it easier for teams to stay on the same page. Being able to share KPI data in a secure, user-friendly way, whether it's with team members, vendors, or customers, is essential for effective collaboration.
-
Data Integrations
But what about data integrations? Connecting KPI software with existing systems can help businesses build a more efficient workflow. For example, data from CRM systems, marketing automation tools, and accounting software can be integrated with KPI software to provide a comprehensive view of a company's performance. This feature can save valuable time by automating data collection and analysis.
-
Ease of use
Lastly, ease of use is critical when choosing KPI software. After all, what good is a bunch of fancy features if no one can figure out how to use them? That's why businesses should look for software that is intuitive and user-friendly. The best KPI software should be easy to navigate, with clear instructions and a welcoming interface.
How do I choose the right KPI software for me?
Choosing the perfect KPI software can be daunting, especially with the many available options. However, by carefully assessing crucial factors such as user-friendliness, data representation, analytical prowess, flexibility, and customization options, businesses can zero in on the ideal software platform that caters to their distinct needs.

To tackle this quest, it's important to consider how easily users can navigate the software without the need for extensive training. Additionally, it's crucial for the software to efficiently represent data in a visual manner that's easy to understand.
The ability to analyze KPI data in-depth is another critical factor to look out for, along with the software's ability to scale to accommodate organizational needs and changes. Lastly, a customizable software platform allows businesses to tailor it to their requirements.
With a thorough analysis of these factors, businesses can confidently choose a KPI software platform that aligns with their needs, making data management and analysis a breeze.
Why do Companies use KPI Software?
Companies today must keep a close eye on their performance to achieve their strategic objectives and stay ahead of the competition. To this end, KPI software comes in handy as it provides objective feedback on business performance, helping businesses identify problems and make timely adjustments to their strategies.
What is the recommended KPI software for SMEs?
It can be challenging for businesses across all scales to keep track of their key performance indicators (KPIs). However, some large market players tend to levy a per-user fee for KPI tracking, which can cause implementation expenses to snowball. SimpleKPI emerges as a breath of fresh air in this scenario, offering unlimited users at an affordable, fixed price. By adopting SimpleKPI, businesses can breathe easily without worrying about any hidden fees or costs from additional users. This makes for a cost-effective and hassle-free KPI tracking methodology that any business can benefit from, regardless of its size or scale.
SimpleKPI offers an unlimited plan, so there are no hidden costs, and once more, it's also super easy to get started.
Conclusion
As we have discussed, various factors should be considered when selecting a platform that suits your needs and budget. The article has highlighted the most relevant features of the 15 best KPI software tools available.
It's essential to track your key performance indicators regularly to keep your business on track and aligned with your goals. With the help of KPI software, businesses of all sizes can now have access to affordable and practical tools that offer real-time data to optimize their management processes.
We encourage our readers to take a closer look at the 15 best KPI software platforms mentioned in this article and choose the one that matches their business requirements. By implementing the right KPI software, businesses can set their targets and track their performance regularly, which will help them make informed decisions, increase productivity, and reduce overhead costs.
Free vs paid KPI software
Free tiers in this list are real, but narrow. Perdoo's free plan covers up to 5 users, Hive's free plan covers up to 10, Databox's free plan is limited to a single user, and Cascade offers a free 2-user Planning tier. They're genuinely useful for a founder or a very small team tracking a handful of goals, but the moment you need more seats, more data sources, or deeper reporting, you'll hit the ceiling fast. Paid plans earn their keep once you're managing KPIs across more than a couple of people, or once you want dashboards that update automatically instead of manual entry. SimpleKPI doesn't offer a free-forever plan, only a 14-day trial, trading that off for one flat price that doesn't ration users or features as you grow.
How KPI software pricing works
Most KPI software is sold one of three ways. Per-seat pricing (Tableau, Scoro, Perdoo, Hive, and Plecto in this guide) charges by the number of users, so your bill grows every time you add a teammate. Flat or tiered pricing charges one price regardless of user count, usually scaling with dashboards, data sources, or refresh speed instead; Klipfolio works this way, and SimpleKPI is the clearest flat-price example on this list, with one $79/month plan covering unlimited users, dashboards, reports, and KPIs. Quote-based pricing (Yellowfin, GoodData, KPI Fire, the Cascade paid tiers, the Sisense Enterprise tier, and the Qlik Sense Enterprise tier; Qlik does publish a $300 a month Starter plan) is common among enterprise BI platforms, where a sales conversation is needed to scope data volume, deployment, or support before naming a number. A few tools sit in between and price by usage instead, such as Databox, which charges by the number of data sources connected rather than by seat.

KPI software is a tool that helps organizations track and measure performance against specific goals and objectives. It provides a platform for tracking and analyzing performance metrics, such as customer satisfaction, sales, production efficiency, and financial performance.
Set clear goals with timelines to choose meaningful KPIs, for example, a 10% profit increase in two years or 500 new leads in six months. Each goal might involve KPIs like tracking conversion rates to improve sales.
To ensure accuracy, teams must record relevant data consistently. While sales teams may already use metrics, HR might adopt new tools, such as satisfaction surveys. For larger goals, a project team can track progress and adjust quarterly. KPI software simplifies this by integrating data and visualizing trends over time.
Some suggest that KPIs are being replaced by agile metrics like OKRs, which focus on short-term adaptability. However, KPIs are still crucial for tracking consistent progress toward long-term goals and aligning teams with overall business objectives. Rather than outdated, KPIs are evolving, incorporating real-time data to stay relevant for businesses that need to move quickly.
Yes. Most KPI dashboard platforms, including SimpleKPI, offer affordable entry-level plans built with smaller teams in mind. You can start by tracking the metrics that matter most, then add users, data sources, or dashboards as your business grows, without needing to rebuild your reporting from scratch.
It depends on what you're trying to achieve. If you mainly want to track a core set of metrics and make faster day-to-day decisions, dedicated KPI dashboard software is usually all you need. If your business needs complex data modeling, self-service analytics, or advanced forecasting across many datasets, a full business intelligence platform is likely the better fit.
Not long at all. Once you know which metrics matter most, a simple KPI dashboard can be up and running in under an hour with most modern tools. More complex setups, involving multiple data sources, custom calculations, or detailed user permissions, will naturally take a bit longer, though templates can speed things up.
Yes, a few tools in this guide offer a genuine free plan: Perdoo (up to 5 users), Hive (up to 10 users), Databox (1 user), and Cascade (a 2-user Planning tier). They're useful for a very small team getting started, but most free tiers cap out fast on users, data sources, or reporting depth. SimpleKPI doesn't offer a free-forever plan, only a 14-day trial, in exchange for one flat price that includes everything from day one.
It depends on the tool and how it prices. Free tiers exist for very small teams, and paid plans for growing teams typically run from about $60 to $300 or more per month, though the exact cost depends on whether the tool charges per seat, by dashboard tier, or by data source. Enterprise BI platforms are often quote-based, with pricing disclosed only after a sales conversation. SimpleKPI sits in the middle of that range at one flat $79/month, or $67/month billed annually, with unlimited users included.
Of the platforms compared on 26 July 2026, SimpleKPI was the only one that could be verified as including AI with no credit allowance, token cap or usage top-up, at one flat price of $79 a month. Databox includes AI but rations it by credits that reset monthly and do not roll over, Hive sells its Buzz AI as a paid add-on, and Scoro and Perdoo meter theirs. Several other vendors publish no AI usage limit at all, which means a buyer cannot tell what they are getting until they hit it.
Ten of the fifteen platforms in this guide publish a real price on their own website: SimpleKPI, Databox, Klipfolio, Geckoboard, Plecto, Scoro, Perdoo, Hive, Tableau and Qlik Sense. Cascade, KPI Fire, Sisense, GoodData and Yellowfin do not publish a price for their paid tiers on their own site. Some are sales-quoted, and some disclose the figure only once you are inside a signup or trial flow. Checked 26 July 2026. Published pricing matters because it is the only way to compare total cost before you talk to anyone.
As of 26 July 2026, SimpleKPI, Tableau, Qlik Sense, Sisense and KPI Fire all offer both forecasting and anomaly detection. The difference is what they cost and how they are sold: SimpleKPI includes both in one published flat plan at $79 a month, while Tableau and Qlik Sense are per-seat or capacity-priced, and Sisense and KPI Fire publish no price at all. Klipfolio puts both behind its $45 a month Advanced Analyses add-on, Databox limits forecasting to its $399 a month Growth tier, and Geckoboard offers neither.
Track KPIs like these on SimpleKPI's KPI dashboards, with one flat price for unlimited users and a 14-day free trial.