SimpleKPI Video Guides Every part of SimpleKPI, shown on screen
Twelve short videos, each showing one part of SimpleKPI on screen, step by step. Watch them in order, or go straight to the one you need.
- Guides
- 12 guides
- Total length
- 20 minutes in total
- Length of each
- 1 to 2½ minutes each
- Chapters
- 57 chapters to jump to
 Watch 2:25
Start here
Getting started
A two-minute start for a new account: add your KPIs, add your data, create a dashboard, then invite your team.
- 1Add your KPIs0:16
- 2Add your data0:51
- 3Create a dashboard1:15
- +Bring your team in1:44
Stage 2 of 5
Your KPIs
Three guides on the KPIs themselves: their settings, the ones that work themselves out, and how to split one KPI into its parts.
 2:12
Guide 2
Your KPIs in depth
What every setting on a KPI does
 1:42
Guide 3
Calculated KPIs
KPIs that work themselves out
 1:48
Guide 4
Breakdowns
One KPI, by product, project or team
Tools for this stage
- KPI Generator
Get KPIs suggested for your business
- KPI Library
Over 200 KPIs with formulas
- KPI Templates
Ready-made sets by industry
Stage 3 of 5
Your data
Getting figures in, either by hand on the KPI Data sheet or brought in from a spreadsheet, an app or the API.
 1:32
Guide 5
The KPI Data sheet
Your figures in, in two minutes
 1:53
Guide 6
Importing and connecting
Spreadsheets and apps, brought in
Tools for this stage
- Getting started FAQ
Spreadsheets and app connections
- Support
Step-by-step help articles
Stage 4 of 5
Dashboards and reports
Build a KPI dashboard, share it, and turn the same figures into a report that sends itself.
 1:38
Guide 7
Building a dashboard
The right chart for every question
 1:41
Guide 8
Dates, layout and sharing
The right view, for the right people
 1:41
Guide 9
Reports
Your KPIs, written up and sent
Tools for this stage
- KPI Dashboard Examples
Boards to copy, by industry
- Charts and graphs guide
Which chart suits which question
- KPI reporting
What a scheduled report includes
Stage 5 of 5
Insights, Home and your branding
What Insights tells you about your numbers, how the Home page sums them up, and how to put your own logo and colors on SimpleKPI.
 1:16
Guide 10
Insights and Analytics
What changed, and why
 1:22
Guide 11
The Home page
Your KPI Score and Pulse, arranged
 1:13
Guide 12
Customizing your account
Your logo, your colors, light or dark
Tools for this stage
- KPI Insights
Pulse, Explore and forecasts
- AI at the core
What the built-in AI does
Already using SimpleKPI?
Every guide is in the app too. Open Learn more on any page and pick an article with a play mark: the video plays beside the page you're working on, with its written guide on the next tab.
Where to find them in the app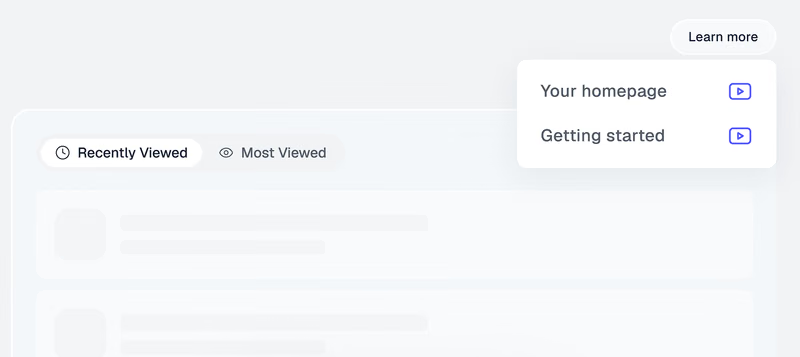
Questions about the guides
How long do the SimpleKPI Video Guides take to watch?
About 20 minutes for all 12. Each guide runs between one and two and a half minutes and covers one part of SimpleKPI. Getting started, the first, takes 2:25.
Do I need a SimpleKPI account to watch them?
No. Every guide plays on its own page here. With an account, the same guides open inside SimpleKPI from the Learn more menu on each page.
Is there a written version of each guide?
Yes. Each guide's page has a full transcript split by chapter, and the videos have English captions. Inside SimpleKPI, each help article also has a written guide beside its video.
Which guide should I watch first?
Getting started. It adds KPIs, adds data, creates a dashboard and invites a team. After that, watch the rest in order or go straight to the one you need.