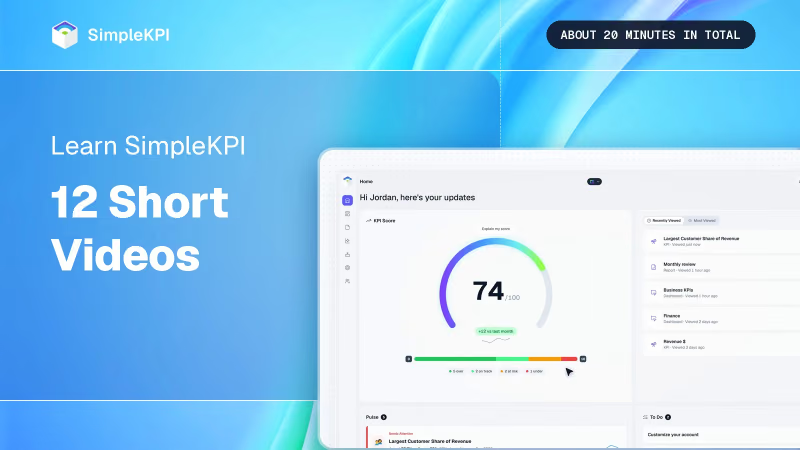
We've made 12 short video guides to SimpleKPI. Each one takes a single part of the app and shows it on screen, step by step, in a minute or two.
Watch all 12 and you've seen the whole of SimpleKPI in about 20 minutes: setting up KPIs, getting your data in, building and sharing dashboards, sending reports, and seeing what's changed in your numbers.
They're built into SimpleKPI, beside the page each one is about, so the right video is there when you need it. They're all on this page too, in order.
The 12 guides
Start with Getting started, then watch the rest in order or go straight to the one you need. Together they run for 20 minutes 24 seconds.
| # | Guide | What it shows | Length |
|---|---|---|---|
| 1 | Getting started | From your first KPI to your first dashboard | 2:25 |
| 2 | Your KPIs in depth | What every setting on a KPI does | 2:12 |
| 3 | Calculated KPIs | KPIs that work themselves out | 1:42 |
| 4 | Breakdowns | One KPI, by product, project or team | 1:48 |
| 5 | The KPI Data sheet | Your figures in, in two minutes | 1:32 |
| 6 | Importing and connecting | Spreadsheets and apps, brought in | 1:53 |
| 7 | Building a dashboard | The right chart for every question | 1:38 |
| 8 | Dates, layout and sharing | The right view, for the right people | 1:41 |
| 9 | Reports | Your KPIs, written up and sent | 1:41 |
| 10 | Insights and Analytics | What changed, and why | 1:16 |
| 11 | The Home page | Your KPI Score and Pulse, arranged | 1:22 |
| 12 | Customizing your account | Your logo, your colors, light or dark | 1:13 |
Every guide uses the same example account, so each one starts where the last left off. And each has chapters, listed under its player here: press one to start the video at that step.
Each guide also has a page of its own, with a full transcript, in the SimpleKPI Video Guides.
Where to find them in SimpleKPI
You don't have to come back to this page. The guides are in the app, in the places you're most likely to want them.
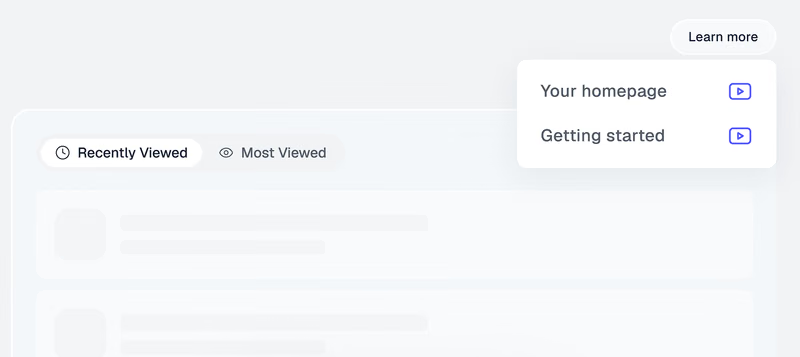
On every page, under Learn more
Each main page in SimpleKPI has a Learn more menu, listing the help articles for that page. An article with a video has a play mark beside it.
Pick one and it opens in the Help panel, over the page you're on. Some open part way in: the article on scheduling a report starts the Reports guide at Schedule it, 56 seconds in.
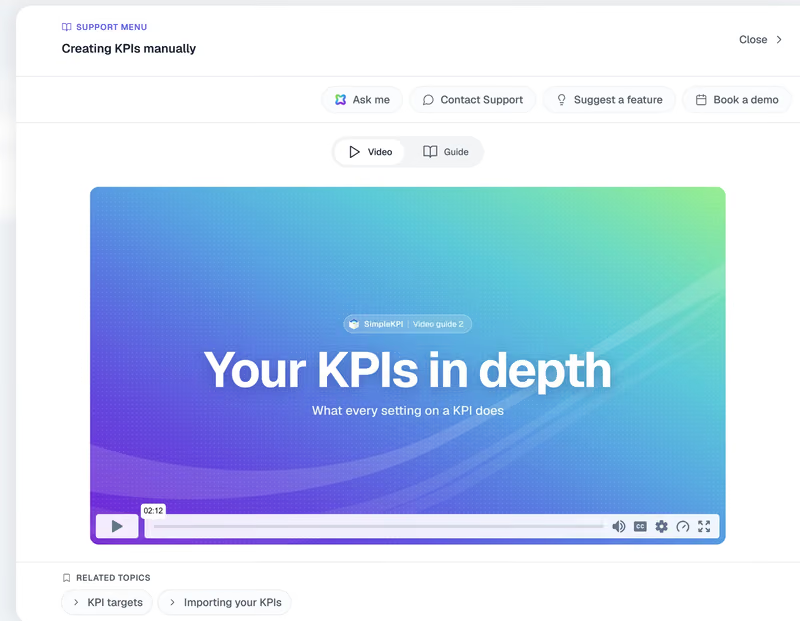
A video and a written guide, side by side
In the Help panel, an article with a written guide has two tabs: Video and Guide. Watch it, or switch to the written steps if you'd rather read. Related topics are listed underneath.
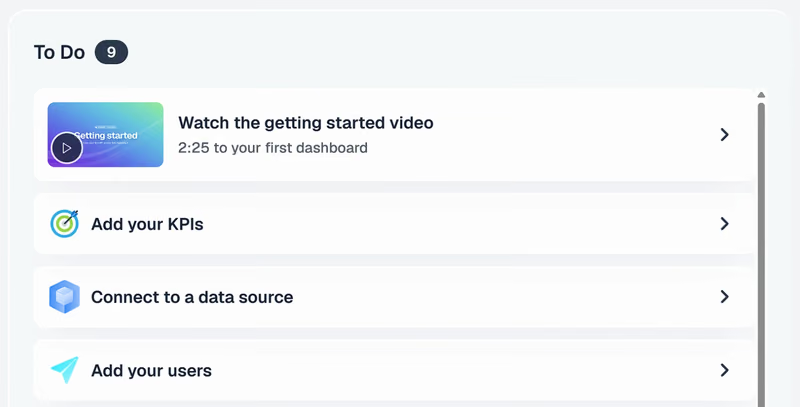
In To Do and the setup card, when you're new
A new account is offered Getting started first. Watch the getting started video is the top row of the To Do list on Home, until you've watched it or the account has KPIs, data and a dashboard.
On the KPIs, KPI Data and Dashboards pages, a small card in the corner offers it too. It starts the video at the step for the page you're on: adding KPIs, adding data, or creating a dashboard.
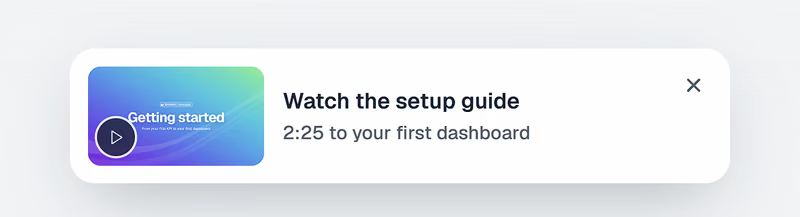
Close the card and it shrinks to a small button. Choose Don't show again and it's gone. Either way, Getting started stays at the top of Help & support, under Start here.
Tip: Stuck at any point? Use Ask me at the top of every page in SimpleKPI.
Start here
If you only watch one, watch this one.
1. Getting started 2:25
If you're new to SimpleKPI, start here. It takes you from an empty account to your first dashboard in three steps, then brings your team in.
You add your KPIs, each with a name, how often you'll update it and a target. You type in a few months of figures, or upload a spreadsheet you already keep. Then you create a dashboard, add a chart and see your figures against your target.
Your KPIs
Three guides on the KPIs themselves: their settings, the ones that work themselves out, and how to split one KPI into its parts.
2. Your KPIs in depth 2:12
Every KPI has a few settings that decide how it's measured, colored and added up. This guide goes through each one.
How often it's updated, and its format. Its target, which direction is best, and the RAG thresholds that color it red, amber or green. Whether it adds up as a total or an average, and a daily KPI's working week. Then categories, to keep a growing list in order.
3. Calculated KPIs 1:42
Some KPIs are worked out from others, like a margin, an average sale or a gross profit. SimpleKPI can calculate them for you, so nobody has to type them in.
The guide builds Gross Profit as Revenue minus Cost of Sales: choosing Calculated, picking KPIs into the formula, deciding whether it's worked out by frequency or by total, and calculating its target. Then it fills itself in on KPI Data.
4. Breakdowns 1:48
Often one number is really several: revenue from different products, sales from different teams. With breakdowns you track the parts of a KPI without making a new KPI for each one.
The guide makes a Products breakdown and its items, gives Revenue a set for each product with its own target, ticks each person against the sets they enter, and shows the row each set gets on KPI Data.
Your data
Then getting figures in, either by hand on the KPI Data sheet or brought in from a spreadsheet, an app or the API.
5. The KPI Data sheet 1:32
KPI Data is where your figures go in. This guide shows how to make that a two-minute job.
Choose whose sheet you're on and enter figures for your team. Switch between the multi-period and single-period views, step through periods, and filter by category. Add a note when a figure needs explaining. And upload your figures from a spreadsheet, or export your sheet to Excel.
6. Importing and connecting 1:53
When your figures already live somewhere else, SimpleKPI can bring them in. This guide shows three ways.
Import any spreadsheet: the AI reads it, works out your KPIs and their figures, asks about anything unclear, and lets you review it all before it's saved. Connect an app such as Xero, Google Sheets, Google Analytics, Stripe, Google Search Console or Zendesk, and its KPIs fill themselves. Or create an API key so your own systems can send figures in.
Dashboards and reports
These three build a KPI dashboard, share it, and turn the same figures into a report that sends itself.
7. Building a dashboard 1:38
A dashboard is only as good as its charts. In SimpleKPI you start with what you want to show, and it picks the chart for you.
The guide picks a goal, from a trend over time to a single value, and tries the charts for it. It views a KPI by month and then by product, compares it with the same period last year, and filters it to one product before adding it to the dashboard.
8. Dates, layout and sharing 1:41
Your dashboard's built. This guide sets its dates once for every chart, arranges it, and gets it in front of the people who need it.
Set the dashboard's dates with Rolling on and they move forward by themselves. Drag charts to move and resize them, and let the AI write a few lines on what a chart shows. Share the dashboard with people in your account, limited to the data each may see, or with a public link. Embed a chart on your website, download a PDF, or put it on a wall screen in full screen.
9. Reports 1:41
A dashboard is for looking. A report is for sending: the same story, in your team's inboxes, on a schedule.
Start from a template, let the AI build one, or build your own. Add a status overview, off-track items, biggest changes, a chart and a summary written by the AI, all for the dates you set once. Then schedule it daily, weekly or monthly to people in your account, who get it as a PDF with a link to the live report.
Insights, Home and your branding
The last three cover what Insights tells you about your numbers, how the Home page sums them up, and how to put your own logo and colors on SimpleKPI.
10. Insights and Analytics 1:16
Your dashboards show the numbers. Insights shows you which ones matter, and why.
Pulse picks out the KPI updates that matter: what needs attention, what's awesome, notable moves and anything unusual. Explore takes one KPI up close: this month against target and last year, its trend with a forecast, the AI's verdict in plain words, and How to fix.
11. The Home page 1:22
Home is where you land in SimpleKPI. At a glance, it shows how your KPIs are doing and what's changed.
Your KPI score checks every KPI against its target and rolls them into one number out of a hundred, and Explain my score says why in plain words. Pulse shows your latest updates, Recently Viewed takes you back to your work, and To Do lists what's left to set up. Drag and resize the panels, and turn them on or off in Customize home.
12. Customizing your account 1:13
Make SimpleKPI your own: your logo, your brand color, and light or dark.
In Settings, Customize, upload your logo and it replaces SimpleKPI's in the menu, on reports and on shared dashboards. Pick a brand color from the presets, a hex code or the color picker, and save it for everyone in your account. And each person can choose light, dark, or follow their computer from the profile menu.
Watch them where you work
If you already use SimpleKPI, sign in and the guides are waiting under Learn more on each page.
If you don't, you can try it free for 14 days, no card needed, and follow Getting started with your own KPIs. It's one flat price after that, with the AI included.
We'll add more guides as SimpleKPI grows.

About 20 minutes. The 12 SimpleKPI Video Guides run for 20 minutes 24 seconds in total, and each shows one part of the app in between one and two and a half minutes. The first, Getting started, takes you from an empty account to a first dashboard in 2 minutes 25 seconds.
In three places. The Learn more menu on each page lists that page's help articles, with a play mark beside the ones that have a video. Help & support has Getting started at the top, under Start here. And a new account is offered Getting started in the To Do list on Home and in a small card on the KPIs, KPI Data and Dashboards pages.
Getting started. It adds KPIs, adds data, creates a dashboard and invites a team, which are the steps every account begins with. After that, watch the rest in order or go straight to the one you need.
No. All 12 are on this page. With an account they open inside SimpleKPI, beside the page you're working on, and there's a 14-day free trial with no card needed.
Yes. Each guide has a voiceover and light background music, and nothing plays until you press Play.