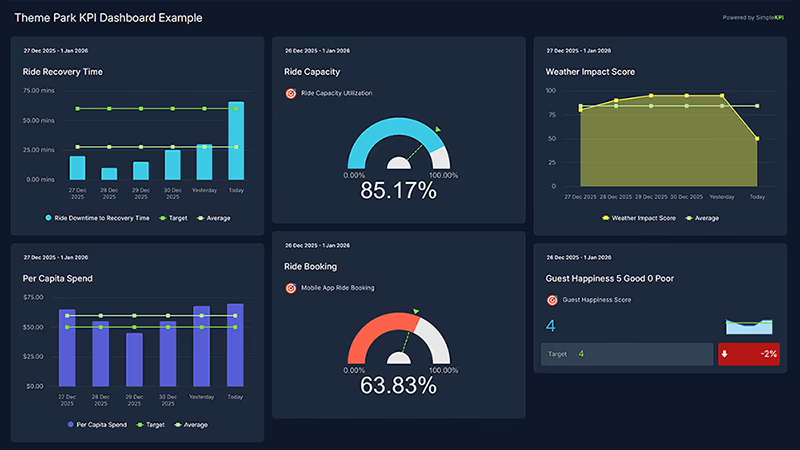
Theme Park Guest Experience Management Dashboard
Deliver smoother, more magical park days by tracking the entire guest journey in real time.
Our Theme Park Guest Experience Dashboard brings ride wait times, downtime, guest sentiment, spending, weather conditions, and app engagement into a single, easy-to-scan view.
From the gate opening to the final fireworks, SimpleKPI helps you spot bottlenecks, redeploy staff, and fine-tune operations so every decision improves the day your guests experience.
What is a Theme Park Guest Experience Dashboard?
Overview
SimpleKPI’s Theme Park Guest Experience Dashboard centralizes your critical park performance data and turns it into decisions your teams can act on right now. It helps operations, guest services, and leadership teams see queues, satisfaction, and revenue in one place. Live visualizations make it simple to balance thrill, safety, and profitability without losing sight of the guest’s perspective.
Who benefits from this dashboard?
- Park Operations Managers: Balance capacity, adjust ride operations, and make on-the-day decisions that keep lines moving and guests smiling.
- Guest Services Teams: Monitor complaints, response times, and satisfaction to intervene before issues affect the wider crowd.
- Finance and Commercial Teams: Track per-capita spend, upsells, and product mix in real time to maximize revenue without harming the experience.
- Marketing and Experience Designers: Understand guest behavior, app usage, and zone popularity to refine campaigns and future attractions.
Set up zone-specific dashboards for different areas of the park. Give each supervisor a focused view of queues, satisfaction, and staffing in their section.
Dashboard Example Overview
This dashboard focuses on eight essential guest experience KPIs trusted by park operators:
- Average Ride Wait Time: Typical time guests spend waiting per attraction, by ride and by zone.
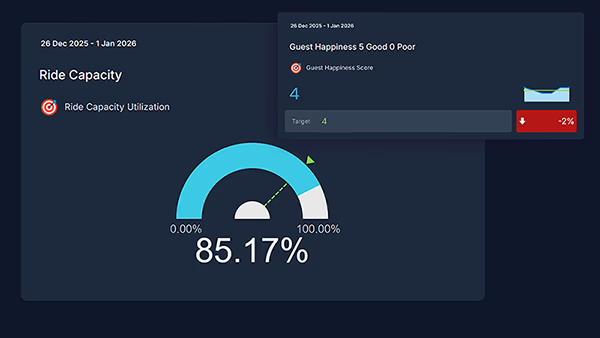
- Ride Capacity Utilization: Percentage of ride capacity used over time to highlight under- and over-utilized attractions.
- Ride Downtime and Recovery Time: Total downtime and average time to restore operations after a disruption.
- Guest Happiness Score: Overall guest satisfaction based on surveys, app ratings, or quick in-park feedback.
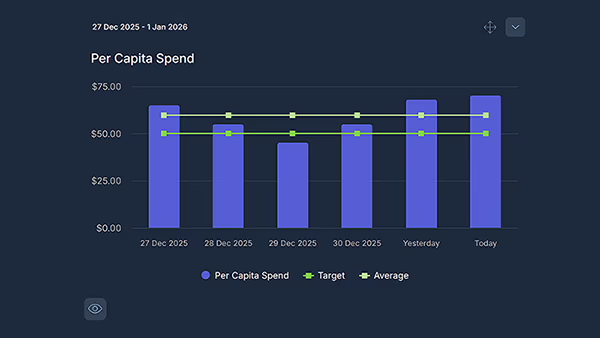
- Per-Capita Spend: Average guest spend across tickets, food and beverage, and merchandise.
- Weather Impact Index: Correlation between weather conditions and attendance, ride usage, and sentiment.
- Mobile App Engagement: Usage of maps, virtual queues, mobile ordering, and notifications per guest.
- Staff Response Time to Guest Issues: Average time from issue raised to resolved for guest complaints and incidents.
Creating a Theme Park Guest Experience Dashboard in SimpleKPI
-
Step 1 Map your guest journey
Identify key touchpoints from entry to exit: ticketing, major rides, shows, food courts, and merch. Decide where queues, satisfaction, and revenue matter most.
Need help defining KPIs? Explore this in-depth KPI selection guide.
-
Step 2 Add guest experience KPIs to SimpleKPI
Set up KPIs for ride wait times, downtime, satisfaction, and per-capita spend. Use tags like “Ride”, “Guest Experience”, and “Revenue” to keep reporting organized.
Download the example spreadsheet containing these Theme Park Guest Experience KPIs
-
Step 3 Connect your park systems
Feed data from ride control systems, ticketing and POS, mobile apps, and survey tools into SimpleKPI using imports, integrations, or the API.
-
Step 4 Choose charts and layouts by role
Create real-time views for operations, guest services, and leadership. Use trend lines for queues, gauges for satisfaction, and tiles for “problem rides”.
-
Step 5 Share, act, and refine
Display dashboards in control rooms, share links with supervisors, and export snapshots for daily debriefs. Adjust KPIs as the park and seasons evolve.
List of Theme Park Guest Experience KPIs
| KPI Name | Typical Target | Description / Calculation |
|---|---|---|
| Average Ride Wait Time | ↓ vs peak thresholds | Average time guests wait per ride, calculated from queue entry to boarding. |
| Ride Capacity Utilization | 80–95% | Actual riders per hour divided by maximum possible riders per hour. |
| Ride Downtime and Recovery Time | ↓ downtime and MTTR | Total time rides are unavailable and average time taken to restore operations. |
| Guest Happiness Score | ≥ 4.5 / 5 | Composite satisfaction rating from surveys, app feedback, or kiosks. |
| Per-Capita Spend | ↑ with stable sentiment | Total in-park revenue divided by total number of guests. |
| Weather Impact Index | Stable vs seasonal norms | Index showing how weather conditions affect attendance, ride usage, and satisfaction. |
| Mobile App Engagement | ↑ adoption and depth | Active users, sessions, and feature usage per guest for the park app. |
| Staff Response Time to Guest Issues | ↓ vs SLA | Average time from an issue being logged to resolved in guest services systems. |
Why Theme Park Dashboards Matter Right Now
Competition for family leisure time is intense, and guests expect short queues, smooth experiences, and personalized moments. Data-driven operations help parks deliver all three without sacrificing safety or profitability.
- Reduce queue frustration—spot problem rides quickly and adjust capacity or entertainment in real time.
- Boost guest satisfaction—link feedback and operations data to understand what really shapes the “wow” moments.
- Increase per-capita revenue—time offers, shows, and upsells to match guest flows and sentiment.
- Protect operations—react faster to downtime, incidents, and weather changes with live dashboards.
- Plan smarter seasons—use historical data to design staffing, promotions, and ride maintenance windows.