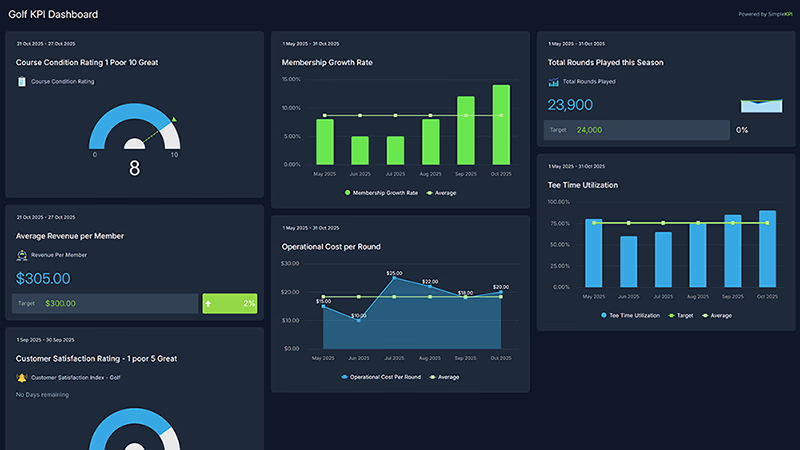
Golf Club Performance Dashboard
Improve your golf operation’s performance with live insights into course usage, revenue, and membership engagement.
The SimpleKPI Golf Club Dashboard provides an at-a-glance view of player activity, bookings, and financial health. Whether you manage a private club or a public course, maintain a perfect balance between player satisfaction and operational efficiency.
What is a Golf Club Performance Dashboard?
Overview
The SimpleKPI Golf Club Dashboard brings membership, finance, and operations data together in one place. It helps identify revenue trends, track peak playing hours, and monitor member satisfaction to drive continuous improvement. Visualize course performance and react instantly to booking or revenue changes with automated data updates.
Who benefits from this dashboard?
- Club Managers: Monitor bookings, capacity, and maintenance performance across facilities.
- Operations Teams: Track staff performance, course upkeep, and guest feedback in real time.
- Finance Managers: View live data on revenue streams, expenses, and cost per round.
- Executives and Committees: Access high-level KPI summaries for planning and strategic decisions.
Use conditional formatting to highlight tee time bottlenecks or dips in course satisfaction for faster response.
Learn More About Golf Club KPIs
Understanding which metrics drive your club’s success is essential for growth. Our detailed guide, Golf Club KPIs: Boost Membership & Business Growth , explains how to use Key Performance Indicators to improve membership retention, optimize revenue streams, and enhance guest satisfaction. Discover the eight most valuable KPIs for golf clubs—such as membership growth, rounds played, and marketing effectiveness—and learn how to track them using SimpleKPI dashboards.
Dashboard Example Overview
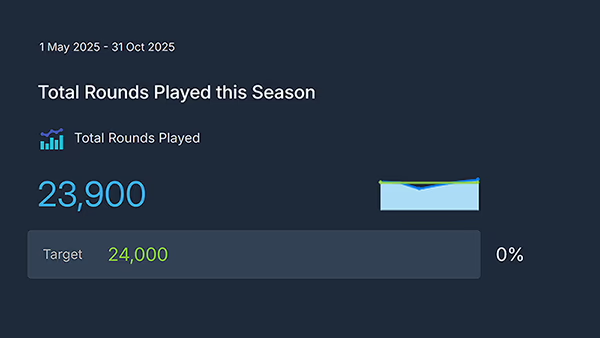
- Total Rounds Played: Tracks player activity; elite clubs aim for year-over-year growth of 10%.
- Membership Growth Rate: Measures new vs retained members; healthy range: >5% annual increase.
- Revenue per Member: Evaluates profitability across categories — target varies by club structure.
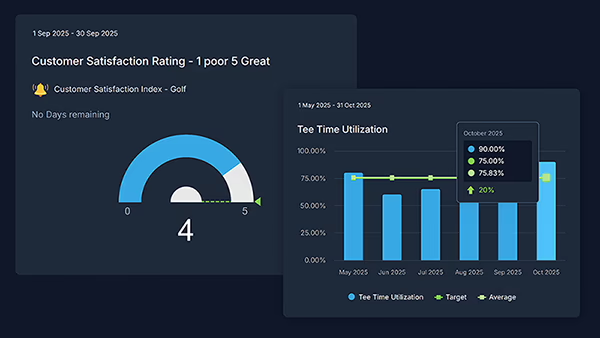
- Tee Time Utilization: Shows booking efficiency; top clubs maintain >85% weekend fill rates.
- Average Spend per Visitor: Reflects on-site spending in pro shop and restaurant.
- Course Condition Rating: Member-rated average across greens, fairways, and facilities.
- Customer Satisfaction Index: Survey-based score combining overall experience and service quality.
- Operational Cost per Round: Evaluates efficiency in resource allocation and maintenance.
Step 1 Open a SimpleKPI Account
Start by signing up at SimpleKPI.com. Click the “Try For Free” button and complete the registration form. You’ll need a business email address and password, but no credit card is required for the free trial.
After registering, check your email for a verification link and follow the instructions to activate your account. Once activated, you’ll be guided through a welcome walkthrough—perfect for first-time users.
Tip: Your free trial gives you 14 days to test all features, including KPI imports and dashboards.
Need help?
Find the full getting started guide at SimpleKPI Support.
Step 2 Add or Import Your Golf KPIs
Once logged in, begin by loading your KPIs. Click the “KPIs” tab in the navigation menu. You can either:
- Manually add KPIs (e.g. Rounds Played, Membership Growth)
- Use the KPI generator or templates library
- Import a KPI spreadsheet: Click “Import a spreadsheet”, then download and complete the template, or use your prepared golf KPIs file. Finally, upload and import your file.
For a ready-to-go set of Golf KPIs, download our template: Golf KPI Spreadsheet.
Tip: KPIs must have a name, frequency (e.g. monthly), and unit. Categories and targets are helpful but optional for setup.
Find Out More
Read the full importing KPIs guide: Importing KPIs in SimpleKPI.
Step 3 Enter Your Data
Navigate to the “Data Entry” tab. Here you’ll see a spreadsheet-like screen where you can:
- Input data for each KPI by date
- Upload a spreadsheet with bulk data (via the 'Import data' button)
- Connect other software or Google Sheets for automated updates
Use the tabs or calendar controls to switch between different periods (daily, weekly, monthly). Data saves automatically as you type.
Tip: Use the filter to view KPIs by category or group. Attach notes for context to any entry if needed.
Learn More
Step-by-step data entry guide: Entering Data Manually.
Step 4 Build Your Dashboard & Charts
Once your KPIs and data are ready, go to the “Dashboards” tab. Click the “Add a Chart” button to start building your visuals.
- Select a chart type (e.g. column, gauge, pie) that best suits the KPI.
- Pick the KPI(s) and a date range to display.
- Customize your chart’s name, colors, and appearance as needed.
- Add more charts to build a comprehensive view of all Golf Club KPIs—drag and drop to position as you wish.
Share your dashboard with team members, export as PDF, or switch between dark and light themes for better clarity.
Tip: Use side-by-side charts to compare metrics like rounds played vs. membership growth for deeper insights.
Golf Club KPIs evaluate membership, revenue, course conditions, and guest satisfaction. Use them to track business health and improve member experience.
Club owners, managers, and operations teams gain visibility on membership performance, bookings, and revenue at a glance.
Yes, connect your golf management or POS systems so metrics refresh automatically with live data.