Construction Project Performance Dashboard
Manage your construction projects smarter with instant visibility into progress, budgets, and safety.
This Construction Dashboard combines job cost tracking, schedule metrics, and safety insights to help you deliver results. Whether you’re managing residential builds or large-scale infrastructure, easily compare actuals versus planned KPIs and ensure every phase stays on target.
What is a Construction Performance Dashboard?
Overview
The SimpleKPI Construction Dashboard unites finance, onsite operations, and scheduling data in one clear view. It enables faster decision-making and tighter control over project budgets and quality benchmarks. Track progress, monitor cost overruns, and identify risks early using live data feeds from project management systems.
Who benefits from this dashboard?
- Project Managers: Monitor timelines, budgets, and workforce efficiency to stay on track.
- Construction Firms: Track multiple projects, compare margin performance, and manage risk portfolios.
- Finance Teams: Gain visibility over real-time costs, commitments, and budget variances.
- Executives: View safety, cost, and progress summaries across all active projects.
Use conditional formatting to flag red‑zone KPIs for schedule delay or budget overrun — the fastest way to spot risk early.
Dashboard Example Overview
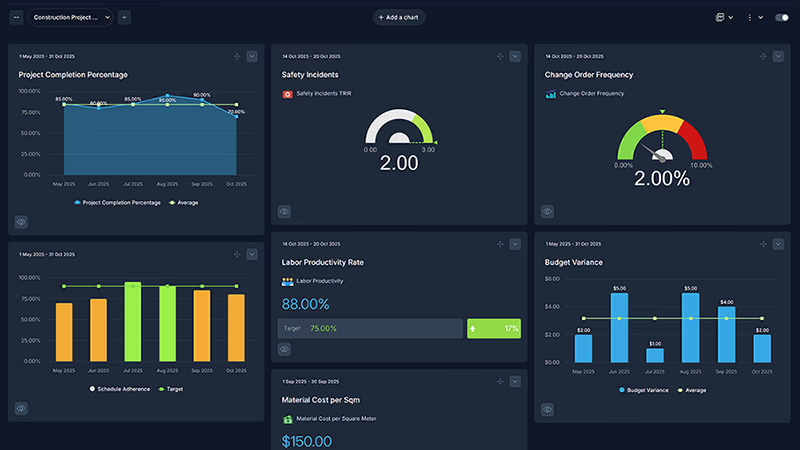
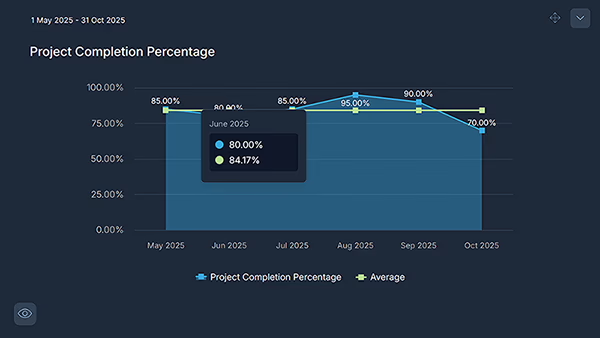
- Project Completion %: Tracks milestone achievement; top builders maintain 90–95% adherence.
- Budget Variance: Compares actual vs budget; goal is ≤5% deviation.
- Labor Productivity: Measured in output per labor hour — typical target: +4% week‑on‑week improvement.
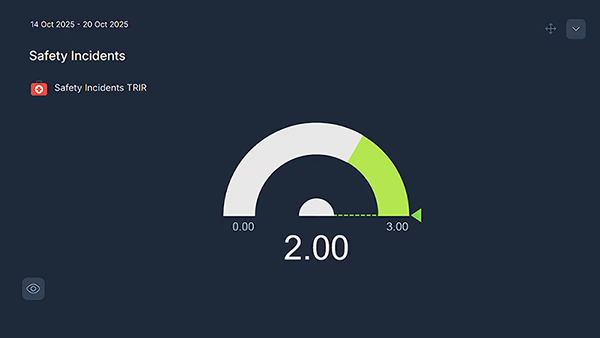
- Safety Incidents: Reports incidents per 10,000 labor hours; best-in-class below 0.6.
- Equipment Utilization: Active machine usage vs idle; maintain above 80% utilization.
- Material Costs/m²: Monitors efficiency in using core materials and sourcing.
- Change Orders: Tracks revisions; aim to stay under 2 per major project phase.
- Schedule Adherence: Ratio of planned vs actual days; >95% on-track rate is preferred.
Construction KPIs measure cost, time, and quality across project phases. Examples include budget variance, safety rates, and timeline adherence.
Contractors, developers, and project owners all benefit from quick visibility on costs, resource allocation, and performance trends.
Yes, integrate live data via API or connect project spreadsheets so metrics update automatically every day.