Fleet & Transport Management Dashboard
Take control of your fleet’s performance the simple way.
Our Fleet & Transport Management Dashboard brings all your go-to KPIs into a single view. No more endless spreadsheets or scattered data. See real-time numbers for fuel efficiency, vehicle utilization, maintenance costs, and driver scores.
Whether you manage ten vans or a nation-wide logistics fleet, SimpleKPI helps you maximize your uptime and minimize those headaches that drain budgets fast.
What is a Fleet & Transport Dashboard?
Overview
SimpleKPI's Fleet & Transport Dashboard delivers centralized management, all flexibly customized for your operations. It gives fleet operators, delivery managers, and logistics pros the agility to respond quickly in an industry where every percent counts. It pulls together live data from telematics, maintenance logs, and driver reports, turning complex stats into visual tiles and charts for instant clarity.
Who benefits from this dashboard?
- Fleet Managers: Spot usage issues, reduce downtime, and schedule servicing before trouble hits.
- Logistics & Delivery Companies: Optimize route planning, track fuel spend, and monitor driver safety/live status.
- Operations & Finance Teams: Benchmark real-time costs, aggregate compliance data, and meet sustainability targets.
- Executives: Get the big picture—cost per distance, total fleet spend, and carbon emissions all at a glance.
Set up role-based dashboards so each team only sees the KPIs most relevant to them. That keeps meetings focused and makes your data way more actionable.
Dashboard Example Overview
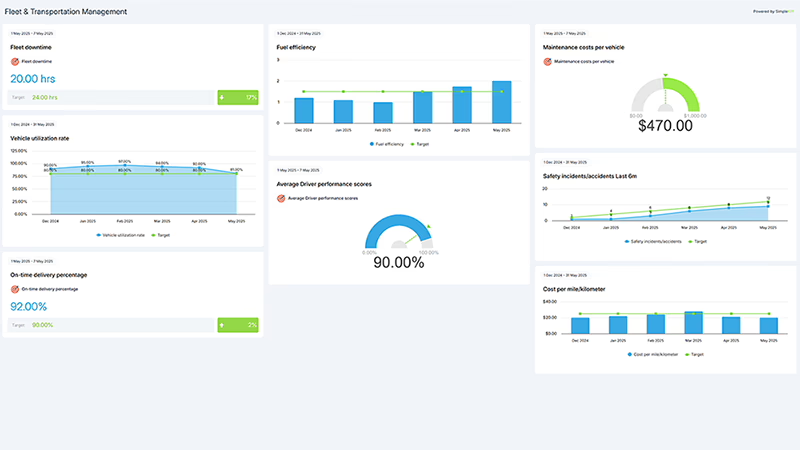
This dashboard centers around 8 critical fleet KPIs chosen by industry experts and trusted by logistics leaders:
- Fuel Efficiency: Track average fuel per mile/km, with the best heavy vehicle fleets achieving 9.8L/100km.
- Vehicle Utilization Rate: See active vs idle time. Top operators stay above 78% utilization.
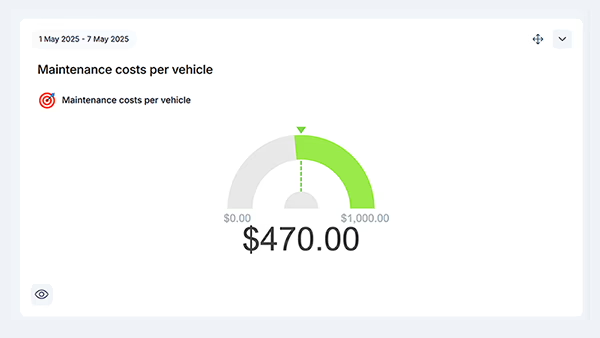
- Maintenance Cost per Vehicle: Keep repairs and servicing visible. Trucks average €0.15/km on repairs.
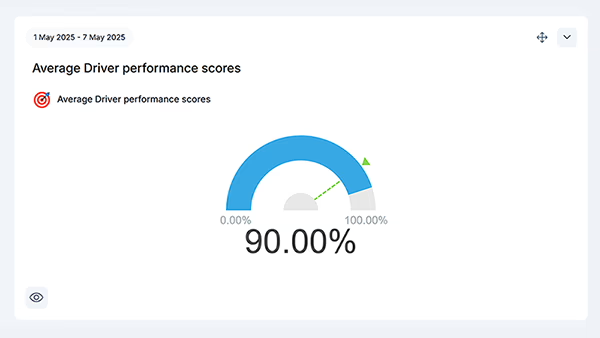
- Driver Performance Scores: Blend safety, efficiency, and compliance into actionable rankings.
- On-Time Delivery Percentage: Aim for 95%+ to be premium in logistics.
- Cost per Mile/Kilometer: Sum up all direct costs—2025 EU average for trucks: €1.42/km.
- Fleet Downtime: Track repair resolution—leaders fix issues within 48 hours.
- Safety Incidents: Benchmark against top fleets (<0.8 incidents/100,000km).
Creating a Fleet & Transport Management Dashboard in SimpleKPI
-
Step 1 Decide on your KPIs
Pick relevant KPIs for your own fleet. Start with industry basics (fuel, maintenance, safety) and personalize if needed—for example, add EV battery health for electric vehicles. Set clear targets and document calculation methods for consistency across your team.
Not sure how to get started then this useful guide will help.
-
Step 2 Add KPIs to SimpleKPI
Create each KPI in SimpleKPI using manual entry for small fleets or import bulk lists via spreadsheet for large ones. Categorize KPIs (asset, cost, compliance) for clarity in reporting.
-
Step 3 Connect your data sources
Manually enter results or set up automated updates. Connect Google Sheets, upload CSVs, or use telematics/data feed APIs for live updates and instant alerts.
-
Step 4 Choose your chart & dashboard layouts
Pick gauge tiles, trend lines, or scorecards for each KPI depending on what’s most actionable for your team. Organize KPIs by business area—keep things easy to scan.
-
Step 5 Share & refine with your teams
Present dashboards in full-screen during meetings, embed them where needed, and share links with stakeholders. Review KPIs regularly and update definitions as your fleet grows and evolves.
List of Fleet KPIs to get you started
| KPI Name | Typical Target | Description / Calculation |
|---|---|---|
| Fuel Efficiency | 9.8L/100km | Avg. fuel use per mile/km—monitors vehicle and route efficiency |
| Utilization Rate | 78% + | % of time vehicles actively deployed/working compared to total availability |
| Maintenance Cost per Vehicle | €0.15/km | Total repair/servicing divided by distance driven per period |
| Driver Performance Score | 92% | Composite safety & compliance score—fewer incidents, higher scores |
| On-Time Delivery % | 95% | Deliveries arriving on schedule vs total delivered |
| Cost per Mile/Kilometer | €1.42/km | Total fleet costs divided by total miles/kms—includes fuel, labor, maintenance |
| Fleet Downtime | <48 hours | Average time vehicles spend out of operation while being repaired |
| Safety Incidents | <0.8/100,000km | Reported incidents/accidents per 100,000km—benchmark for industry leaders |
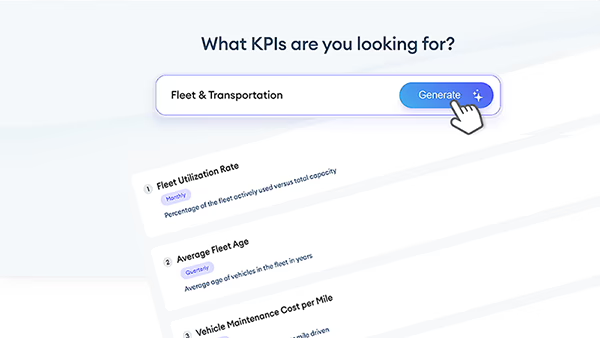
Generate Your Own Fleet Management KPIs
Use our Free KPI Generator to create a tailored Fleet Management KPI set for your business. Get KPI names, descriptions, formulas, and examples — then export to Excel or open in SimpleKPI.
Why Fleet Dashboards Matter Right Now
The pressure’s on: Fuel can be up to 40% of your total costs, driver shortages hit delivery times hard, and vehicles lose days from unexpected breakdowns. Predictive analytics and real-time dashboard alerts make all the difference. Stay ahead on compliance, EV transition, and carbon reporting—and save 5-7% per month just by using data smarter.
- Control costs—spot inefficiencies before they become budget-busters
- Keep everyone on the road with fewer breakdowns and less downtime
- Meet carbon and regulatory goals with automated KPI reports
- Retain top drivers through performance feedback and coaching
- Win more business—shippers love fleets with real-time tracking
Download the Fleet Management KPI Spreadsheet
Download 8 Fleet and Transport KPIs in Excel
More Resources
-
Smart and SMARTER KPIs
Discover how following SMART and SMARTER ideology can improve performance tracking
-
KPI Reports: A Comprehensive Guide
-
Support Portal
Fleet and Transport KPIs are measurable metrics that help you track the health, cost, and efficiency of your vehicles and drivers. Examples: fuel efficiency, utilization rate, maintenance cost, and safety incidents.
Fleet managers, logistics providers, delivery services, and even finance teams use these dashboards to spot issues, cut costs, and improve reliability. Everyone from the operations desk to the boardroom gets a clearer view and better decisions.
Yes! Connect spreadsheets, live telematics, or use the API for instant data updates. Managing a fleet has never been this seamless.