Dental Practice KPI Dashboard Example
With dental patients having more choice than ever, practices must balance outstanding patient care with strong operational performance.
Our Dental Practice KPI Dashboard brings together data on patient flow, chair utilization, treatment acceptance, and collections so you can see what is working and where your clinic might be losing revenue.
From the first patient phone call to final billing, SimpleKPI helps you monitor clinical production, protect your margins, and make the case for operational improvements that keep your practice thriving.
What is a Dental Practice KPI Dashboard?
Overview
SimpleKPI’s Dental Practice Dashboard turns complex scheduling, production, and billing data into a performance story your team can understand at a glance. It helps practice owners, office managers, and front-desk teams see whether schedules are full, treatments are being accepted, and revenue is being collected on time.
Who benefits from this dashboard?
- Practice Owners & Lead Dentists: Monitor clinical production, evaluate overall practice health, and ensure the business is highly profitable without sacrificing patient care.
- Office Managers: Identify scheduling bottlenecks, track front-desk performance, and target resources where patient flow or collections are lagging.
- Front-Desk & Billing Teams: See daily targets for new patient acquisition, recall rates, and accounts receivable to stay on top of daily operations.
- Hygienists & Associates: Track individual chair utilization and treatment presentation success to improve personal performance and patient outcomes.
Use filters for different providers, hygiene vs. doctor columns, or specific clinic locations to surface performance gaps and target support where it is most needed.
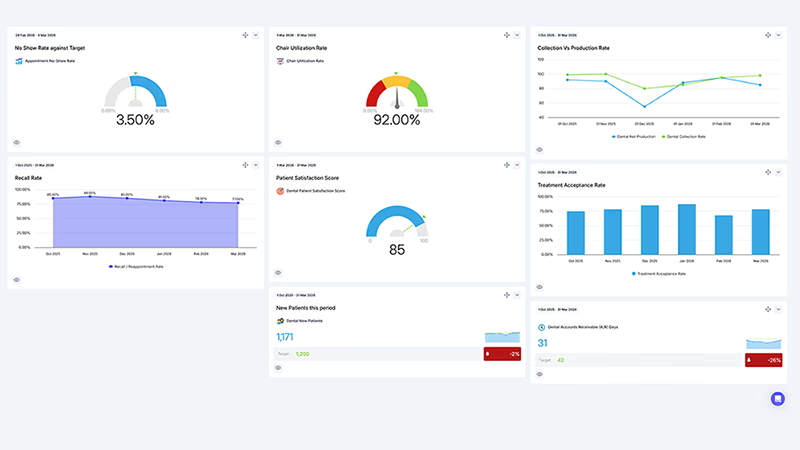
Dashboard Example Overview
This dashboard focuses on nine essential operational and financial KPIs used by modern dental practices:
- New Patients: The number of first-time patients seen in the period, indicating marketing and referral effectiveness.
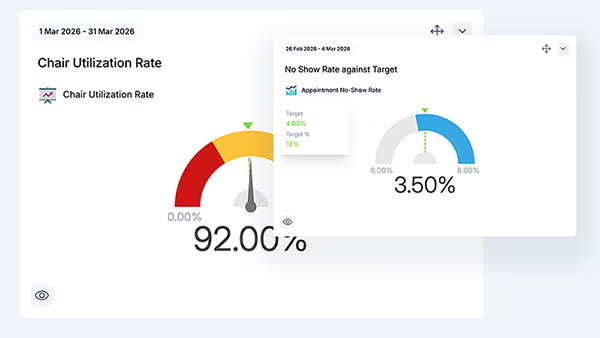
- Appointment No-Show Rate: The percentage of missed appointments compared to total scheduled appointments.
- Recall / Reappointment Rate: The proportion of patients who rebook their hygiene or recall visit within the recommended window.
- Chair Utilization Rate: The percentage of available chair hours that are actively booked or used for patient care.
- Treatment Acceptance Rate: The percentage of presented treatment plan value that is actively accepted and scheduled by patients.
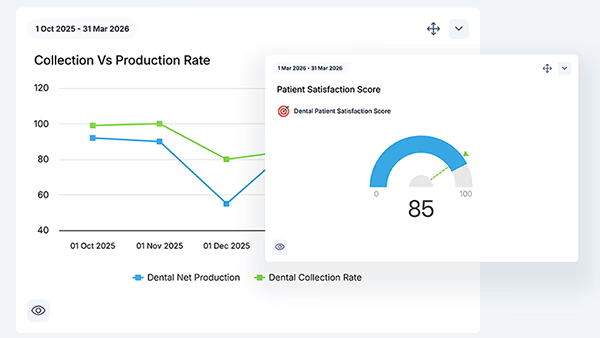
- Net Production: Total clinical production value after PPO/insurance adjustments and write-offs.
- Collection Rate: The percentage of net production that is successfully collected from patients and insurance companies.
- Accounts Receivable (A/R) Days: The average number of days it takes for the practice to collect payment for completed treatments.
- Patient Satisfaction Score: The average score from post-visit patient surveys, linking service quality to long-term retention.
Creating a Dental Practice Dashboard in SimpleKPI
-
Step 1 Map your patient journey
Identify key stages from the first call to final payment: new patient booking, hygiene recall, treatment presentation, production, and billing.
Need help defining KPIs? Explore this in-depth KPI selection guide.
-
Step 2 Add practice KPIs to SimpleKPI
Set up KPIs for new patients, no-show rates, chair utilization, and collection rates. Use tags like “Front Desk”, “Clinical”, and “Financial” to keep reporting organised.
Download the example spreadsheet containing these Dental Practice KPIs
-
Step 3 Connect your scheduling and billing data
Feed data from your practice management software (PMS), patient communication tools, and accounting systems into SimpleKPI using imports, integrations, or the API.
-
Step 4 Build views for different team members
Create focused dashboards for the owner, office manager, and front desk. Use tiles for high-level production, trend lines for A/R days, and breakdown charts for provider-level treatment acceptance.
-
Step 5 Share, learn, and improve
Share dashboards with your staff, use them in morning huddles or monthly reviews, and refine your KPIs as your practice grows and data quality evolves.
List of Dental Practice KPIs
| KPI Name | Typical Target | Description / Calculation |
|---|---|---|
| New Patients | ↑ steady growth | Number of first-time patients seen in the practice during a specific period. |
| Appointment No-Show Rate | < 5 - 10% | Number of missed or late-cancelled appointments divided by total scheduled appointments. |
| Recall / Reappointment Rate | ≥ 85% | Percentage of patients who schedule their next hygiene or recall visit before leaving the office. |
| Chair Utilization Rate | ≥ 85 - 90% | Hours of chair time actively booked and used for patient care divided by total available chair hours. |
| Treatment Acceptance Rate | ≥ 70% | Total dollar value of treatment plans accepted by patients divided by the total dollar value presented. |
| Net Production | ↑ vs prior month | Total gross production minus insurance adjustments, provider write-offs, and discounts. |
| Collection Rate | ≥ 98% | Total revenue collected divided by net production over the same period. |
| Accounts Receivable (A/R) Days | < 30 days | Average number of days it takes to collect payment from patients and insurance after treatment is completed. |
| Patient Satisfaction Score | ↑ positive feedback | Average score from patient post-visit surveys (such as CSAT or Net Promoter Score). |
Why Dental Practice Dashboards Matter Right Now
The dental industry is becoming increasingly competitive, and operational costs are under pressure, making it essential to prove that your clinic runs efficiently and profitably.
- Maximise chair time—show how reducing no-shows and optimizing the schedule directly increases daily revenue.
- Make performance visible—connect marketing, clinical production, and billing to tell a complete story of your practice's health.
- Improve patient retention—use recall and satisfaction metrics to ensure your active patient base continues to grow.
- Empower your team—give the front desk, hygienists, and doctors a shared, data-driven view of daily targets.
- Protect your cash flow—use clear, visual evidence of collections and A/R days to identify billing bottlenecks before they impact payroll or growth.
A Dental Practice KPI dashboard tracks how effectively a clinic manages patient flow, clinical production, chair utilization, and financial collections to ensure profitability without sacrificing patient care.
Practice owners, lead dentists, office managers, and front-desk teams use these dashboards to understand daily operational targets, identify scheduling gaps, and monitor financial health.
You can connect data from practice management software (PMS), patient communication tools, and accounting systems via spreadsheets, integrations, or the SimpleKPI API to keep the dashboard up to date.