Youth Homelessness Prevention Outcomes Dashboard
Prevent youth homelessness before crisis by tracking early warning signs, interventions, and long-term outcomes in a single view.
Our Youth Homelessness Prevention Dashboard brings together data on at-risk referrals, housing stability, education and employment, wellbeing, and equity of outcomes so you can see what is working and where young people are still falling through the gaps.
From the first risk flag to 12 months after an intervention, SimpleKPI helps you evidence prevention, protect limited resources, and make the case for services that keep young people safely housed.
What is a Youth Homelessness Prevention Dashboard?
Overview
SimpleKPI’s Youth Homelessness Prevention Dashboard turns complex case, housing, and outcomes data into a prevention story your teams and funders can understand at a glance. It helps frontline services, managers, and commissioners see whether interventions are avoiding homelessness, sustaining stable housing, and supporting education and wellbeing over time.
Who benefits from this dashboard?
- Youth Homelessness Charities: Evidence which programmes prevent homelessness, compare outcomes by intervention type, and report impact clearly to trustees and funders.
- Local Authorities and Social Services: Monitor prevention performance across regions and partners, identify pressure points, and target resources where risk is highest.
- Funders and Commissioners: See prevention success rates, sustained outcomes, and cost per outcome to inform commissioning, grant decisions, and policy.
- Multi-Agency Partnerships: Share a common view of risk, referrals, and outcomes across housing, education, health, and youth services to coordinate a genuine prevention system.
Use filters for age, gender, care experience, and other characteristics to surface inequalities in outcomes and target support where it is most needed.
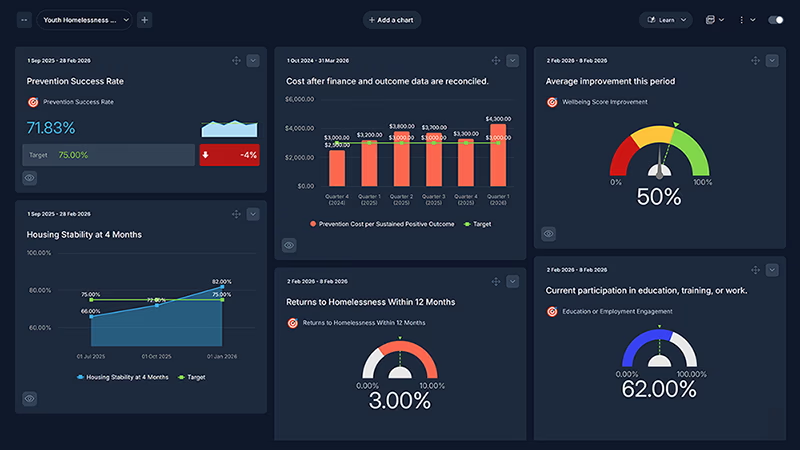
Dashboard Example Overview
This dashboard focuses on eight essential prevention KPIs used by youth homelessness and social services teams:
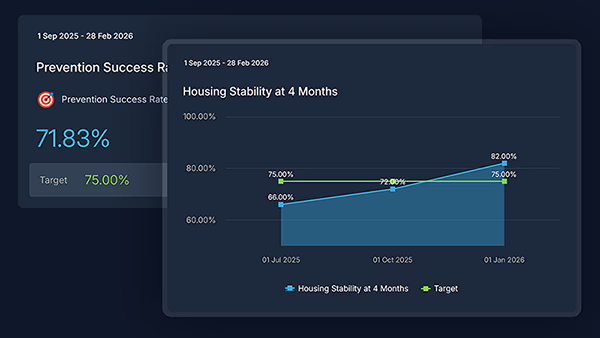
- Prevention Success Rate: Percentage of at-risk cases where homelessness was successfully avoided over a defined period.
- Time from Risk Flag to First Contact: Average time between a young person being identified as at risk and first meaningful contact from services.
- Housing Stability at 6 Months: Proportion of young people who remain in safe, stable housing six months after intervention.
- Returns to Homelessness Within 12 Months: Percentage of young people who experience homelessness or return to shelter within a year of a prevention outcome.
- Education or Employment Engagement: Share of young people who are in education, training, or employment at follow-up checkpoints.
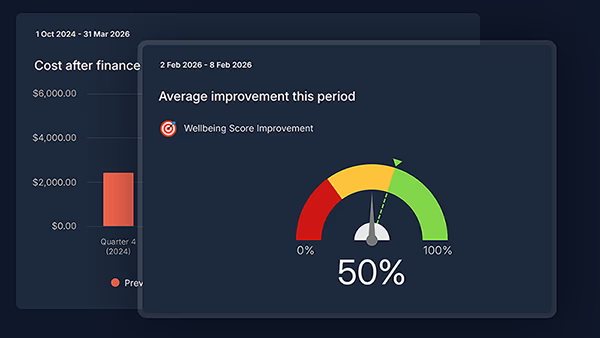
- Wellbeing Score Improvement: Change in self-reported wellbeing or mental health scores between intake and follow-up.
- Equity of Outcomes by Demographic Group: Comparison of prevention and stability rates across key groups (e.g. care-experienced, LGBTQ+, migrant youth).
- Prevention Cost per Sustained Positive Outcome: Total prevention spend divided by the number of young people with stable housing and positive engagement at 6 or 12 months.
Creating a Youth Homelessness Prevention Dashboard in SimpleKPI
-
Step 1 Map your prevention journey
Identify key stages from first risk flag to long-term follow-up: referral, assessment, intervention, housing outcome, and check-ins at 3, 6, and 12 months.
Need help defining KPIs? Explore this in-depth KPI selection guide.
-
Step 2 Add prevention KPIs to SimpleKPI
Set up KPIs for prevention success, response times, housing stability, and education or employment outcomes. Use tags like “Prevention”, “Housing”, and “Youth Outcomes” to keep reporting organised.
Download the example spreadsheet containing these Youth Homelessness Prevention KPIs
-
Step 3 Connect your case and housing data
Feed data from case management systems, outreach logs, housing placements, and education/employment status into SimpleKPI using imports, integrations, or the API.
-
Step 4 Build views for different stakeholders
Create focused dashboards for frontline teams, managers, and funders. Use tiles for high-level outcomes, trend lines for stability and returns, and breakdown charts for demographic equity.
-
Step 5 Share, learn, and improve
Share dashboards with partners, use them in case reviews and strategy meetings, and refine your KPIs as services, policies, and data quality evolve.
List of Youth Homelessness Prevention KPIs
| KPI Name | Typical Target | Description / Calculation |
|---|---|---|
| Prevention Success Rate | ↑ year on year | Number of at-risk cases where homelessness was avoided divided by total at-risk cases closed in the period. |
| Time from Risk Flag to First Contact | ↓ vs service standard | Average time between a young person being identified as at risk and first meaningful engagement by services. |
| Housing Stability at 6 Months | ≥ 80% stably housed | Number of young people in safe, stable housing six months after intervention divided by those with completed 6‑month follow-up. |
| Returns to Homelessness Within 12 Months | ↓ over time | Number of young people who experience homelessness or return to shelter within 12 months divided by those with a previous prevention outcome. |
| Education or Employment Engagement | ↑ engagement | Percentage of young people in education, training, or employment at follow-up checkpoints. |
| Wellbeing Score Improvement | ↑ positive change | Average change in self-reported wellbeing or mental health score between intake and latest follow-up. |
| Equity of Outcomes by Demographic Group | Parity across groups | Comparison of key outcomes (prevention success, stability) across defined demographic groups to highlight gaps. |
| Prevention Cost per Sustained Positive Outcome | ↓ with stable quality | Total prevention programme costs divided by number of young people with stable housing and positive engagement at 6 or 12 months. |
Why Prevention Dashboards Matter Right Now
Youth homelessness is rising in many regions, and budgets are under pressure, making it essential to prove that prevention is possible and that specific interventions work.
- Shift investment upstream—show how early identification and support reduce crisis shelter use and long-term costs.
- Make outcomes visible—connect housing, education, and wellbeing to tell a complete story of each young person’s journey.
- Target support fairly—use equity views to ensure care-experienced, LGBTQ+, and other groups are not left behind.
- Strengthen partnerships—give housing, social care, and youth services a shared, data-driven view of prevention.
- Build the case for change—use clear, visual evidence to influence policy, funding, and service design.