Environmental Sustainability Management Dashboard
Track and improve your organization’s eco-performance in real time.
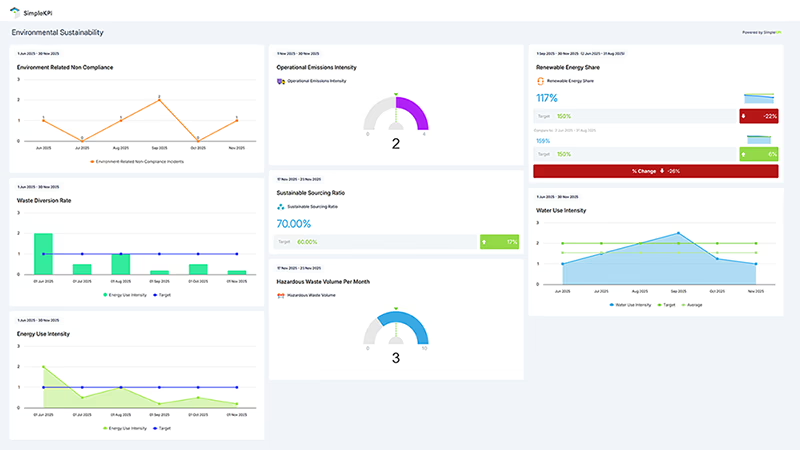
Our Environmental Sustainability Dashboard brings all your key metrics together: monitor emissions, resource use, waste, and compliance in a single, clear view.
Whether you’re aiming for regulatory compliance, lowering operational costs, or preparing annual ESG reports, SimpleKPI makes it easy to set targets, visualize trends, and keep your teams aligned.
What is an Environmental Sustainability Dashboard?
Overview
SimpleKPI’s Environmental Sustainability Dashboard centralizes your critical environmental data and delivers actionable insights for continuous improvement. It helps operations, ESG, and compliance teams measure progress, benchmark performance, and meet both internal and external goals. Unified visualizations simplify even the most complex eco-metrics—making sustainability tangible and reportable.
Who benefits from this dashboard?
- ESG and Compliance Officers: Demonstrate regulatory progress and prepare disclosures using reliable, real-time KPI data.
- Operations Teams: Optimize resource efficiency and reduce waste in day-to-day operations.
- Executive Leadership: Align environmental priorities with business goals and communicate results to stakeholders.
- Sustainability Consultants: Benchmark performance, identify opportunities for improvement, and support eco-certification initiatives.
Set up role-based dashboards so stakeholders only see their most relevant KPIs. Keep discussions focused and your compliance process streamlined.
Dashboard Example Overview
This dashboard focuses on eight essential sustainability KPIs trusted by environmental leaders:
- Energy Use Intensity: Total energy used per unit of output (e.g., kWh per product, or per revenue).
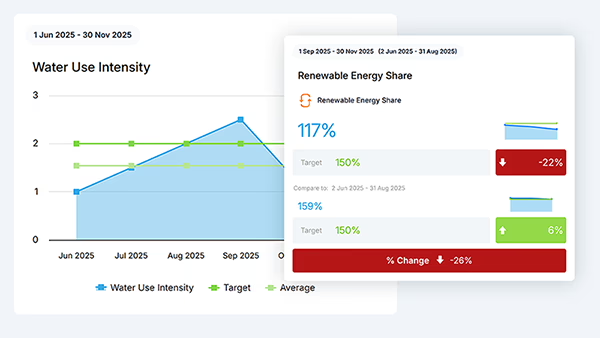
- Renewable Energy Share: Percentage of total energy consumption generated from certified renewable sources.
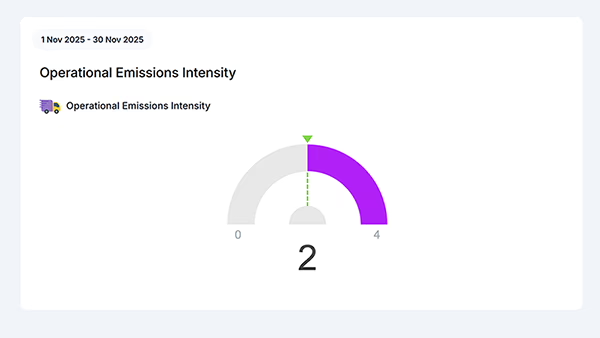
- Operational Emissions Intensity: Direct greenhouse gas emissions per output (tonnes CO₂e per unit or revenue).
- Waste Diversion Rate: Percentage of waste diverted from landfill via recycling, composting, or reuse.
- Hazardous Waste Volume: Total hazardous material disposed (e.g., kg per quarter or per output).
- Water Use Intensity: Volume of water used per unit of output (e.g., liters per product or per revenue).
- Environment-Related Non-Compliance Incidents: Count of environmental breaches or regulatory issues in the reporting period.
- Sustainable Sourcing Ratio: Portion of inputs and materials sourced with recognized eco-certifications (FSC, organic, etc.).
Creating an Environmental Sustainability Dashboard in SimpleKPI
-
Step 1 Define your KPIs
Identify the most material and actionable eco-metrics for your organization. Establish clear definitions and baselines for each KPI for alignment and consistency.
Need guidance? See this in-depth KPI selection guide.
-
Step 2 Add sustainability KPIs to SimpleKPI
Set up KPIs with manual entry for small datasets, or bulk import from sustainability spreadsheets and ESG reporting files. Tag by resource, emissions, and compliance for meaningful reports.
Download the example spreadsheet containing these Environmental Sustainability KPIs
-
Step 3 Connect your sustainability data
Bring in data manually or automatically. Link financial systems, utility reads, water bills, and resource management tools, or leverage APIs for seamless updates.
-
Step 4 Choose your charts & dashboard layouts
Mix trend lines, gauge visuals, and scorecards by KPI type. Separate regulatory, resource, and emissions indicators for clear reporting.
-
Step 5 Share and refine dashboards
Present visualizations in meetings and reports, embed dashboards on your intranet, export to PDF, and regularly update definitions and thresholds as your eco-initiatives evolve.
List of Environmental Sustainability KPIs
| KPI Name | Typical Target | Description / Calculation |
|---|---|---|
| Energy Use Intensity | ↓ year-on-year | Total energy used per unit output (kWh per product or per revenue). |
| Renewable Energy Share | ≥ 50% | Proportion of total energy from certified renewable sources. |
| Operational Emissions Intensity | ↓ year-on-year | Operational GHG emissions per output (tonnes CO₂e per revenue or unit). |
| Waste Diversion Rate | ≥ 75% | Percentage of waste not sent to landfill (recycled, composted, or reused). |
| Hazardous Waste Volume | 0 or ↓ trend | Total hazardous materials disposed, measured over time (kg or tonnes). |
| Water Use Intensity | ↓ year-on-year | Water consumed per output (litres per product, or per revenue). |
| Environment-Related Non-Compliance Incidents | 0 | Reported number of regulatory or permit breaches per year. |
| Sustainable Sourcing Ratio | ≥ 60% | Share of inputs/materials from eco‑certified or audited suppliers. |
Why Environmental Dashboards Matter Right Now
The stakes have never been higher: Resource costs are volatile, regulatory requirements are more demanding, and ESG expectations shape stakeholder trust. Data-driven sustainability isn’t just compliance—it’s a competitive advantage. Track, benchmark, and act on your environmental impact in real time to stay ahead of the curve and build long-term value.
- Reduce waste—spot inefficiencies and lower your resource consumption before costs escalate
- Meet environmental and regulatory targets—automate KPI reporting for audits and disclosures
- Promote a culture of sustainability—engage your teams and supply chain in eco-friendly practices
- Limit environmental risks—catch non-compliance and high-impact issues fast
- Enhance brand reputation—demonstrate progress with credible, transparent data