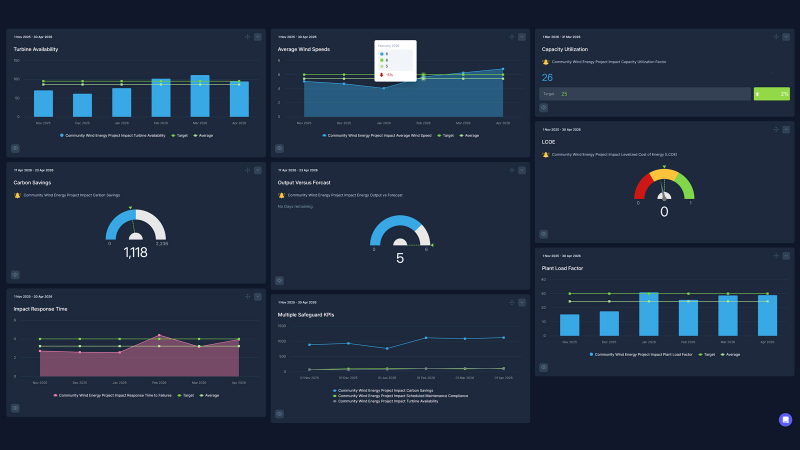
Community Wind Energy Project Impact Dashboard Performance Dashboard
Community-owned wind energy projects deliver clean power, local income, and environmental wins, but success hinges on precise performance tracking. This **Community Wind Energy Project Impact Dashboard** centralizes **Turbine Availability**, **Carbon Savings**, and **Local Financial Returns** to prove ROI and sustain member buy-in.
SimpleKPI's intuitive software turns complex data into real-time visuals, helping co-op managers optimize turbine uptime, cut costs via **Levelized Cost of Energy (LCOE)**, and showcase **Carbon Savings** for grants. Build trust with locals through transparent **Member Engagement Rate** metrics while scaling sustainably.
What is a Community Wind Energy Project Impact Dashboard Dashboard?
Overview
Community wind energy projects empower locals with ownership stakes in renewable assets, generating revenue from turbine output while slashing emissions. This KPI dashboard monitors operational efficiency, financial health, and social impact in one view, enabling data-driven decisions for co-op boards and investors. Track **Energy Output vs Forecast** against weather data, ensure **Scheduled Maintenance Compliance**, and visualize **Local Financial Returns** to demonstrate shared prosperity.
Unlike generic energy tools, SimpleKPI tailors dashboards for community dynamics—highlighting Member Engagement Rate alongside technical metrics like Capacity Utilization Factor. Real-time alerts on Response Time to Failures prevent downtime, while Plant Load Factor benchmarks performance for expansion. Perfect for proving value to sustainability officers and scaling projects profitably.
Who benefits from this dashboard?
- Co-op Managers: Gain real-time oversight of turbine performance and member returns to drive operational decisions and retain community support.
- Renewable Energy Project Leads: Optimize **Capacity Utilization Factor** and **LCOE** to meet efficiency targets and secure funding for growth.
- Local Authority Sustainability Officers: Quantify **Carbon Savings** and environmental impact with dashboards that support grant reports and policy compliance.
- Community Investors: Monitor **Local Financial Returns** and project health transparently to validate ROI and encourage reinvestment.
Set **Turbine Availability** below 95% to flash red, triggering immediate maintenance alerts to maximize community revenue.
Dashboard Example Overview
This dashboard focuses on these essential KPIs used by community wind energy project impact dashboard teams:
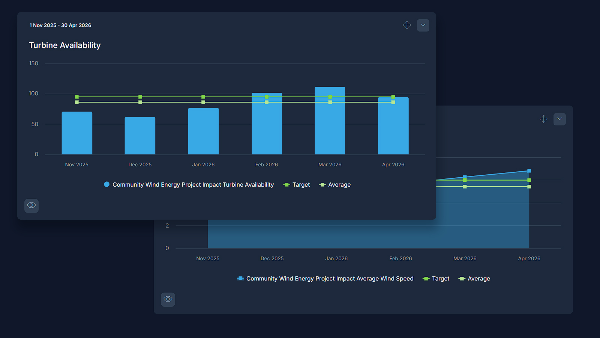
- Turbine Availability: Measures the percentage of turbines operational versus total installed, ensuring maximum uptime for energy generation and revenue.
- Capacity Utilization Factor: Tracks actual energy output relative to maximum possible output based on installed capacity, indicating overall plant efficiency.
- Plant Load Factor: Calculates the ratio of actual energy produced to energy that could be produced at full capacity over time, reflecting consistent performance.
- Energy Output vs Forecast: Compares actual farm energy production to weather-based forecasts, supporting grid commitments and financial planning.
- Local Financial Returns: Monitors revenue distributed to community members or co-op shareholders from energy sales, proving ROI to investors.
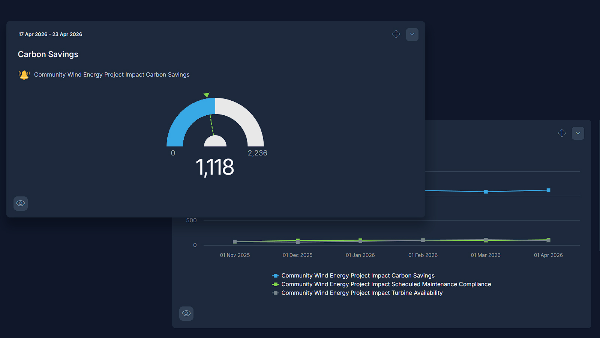
- Carbon Savings: Quantifies CO2 emissions avoided by displacing fossil fuels, essential for grant applications and environmental reporting.
- Average Wind Speed: Records wind speed at turbine hub height, correlating with energy potential and efficiency against weather data.
- Response Time to Failures: Measures time from failure detection to technician dispatch, minimizing downtime in community operations.
- Member Engagement Rate: Tracks active participation in co-op events, meetings, or app usage, fostering sustained community involvement.
- Levelized Cost of Energy (LCOE): Assesses total lifetime costs divided by energy produced, demonstrating economic viability for scaling.
- Scheduled Maintenance Compliance: Evaluates percentage of planned maintenance tasks completed on schedule, preventing unexpected outages.
Creating a Community Wind Energy Project Impact Dashboard Dashboard in SimpleKPI
-
Step 1 Map your community wind energy project impact dashboard journey
Identify the key stages and metrics that matter most to your community wind energy project impact dashboard goals. Define what success looks like at each stage.
Need help defining KPIs? Explore this in-depth KPI selection guide.
-
Step 2 Add Community Wind Energy Project Impact Dashboard KPIs to SimpleKPI
Set up your KPIs in SimpleKPI. Use tags to keep reporting organised by category and team.
Download the example spreadsheet containing these Community Wind Energy Project Impact Dashboard KPIs
-
Step 3 Connect your data
Feed data into SimpleKPI using imports, integrations, or the API to keep your dashboard up to date automatically.
-
Step 4 Build views for different stakeholders
Create focused dashboards for different teams and audiences. Use tiles, trend lines, and breakdown charts to tell a clear performance story.
-
Step 5 Share, learn, and improve
Share dashboards with partners, use them in reviews and strategy meetings, and refine your KPIs as your organisation evolves.
List of Community Wind Energy Project Impact Dashboard KPIs
| KPI Name | Typical Target | Description / Calculation |
|---|---|---|
| Turbine Availability | ≥ 95% | Measures the percentage of turbines operational versus total installed, ensuring maximum uptime for energy generation and revenue. |
| Capacity Utilization Factor | 25-40% | Tracks actual energy output relative to maximum possible output based on installed capacity, indicating overall plant efficiency. |
| Plant Load Factor | ≥ 30% | Calculates the ratio of actual energy produced to energy that could be produced at full capacity over time, reflecting consistent performance. |
| Energy Output vs Forecast | ± 5% variance | Compares actual farm energy production to weather-based forecasts, supporting grid commitments and financial planning. |
| Local Financial Returns | $500-$2,000 per member/year | Monitors revenue distributed to community members or co-op shareholders from energy sales, proving ROI to investors. |
| Carbon Savings | ≥ 1,000 tons/year per MW | Quantifies CO2 emissions avoided by displacing fossil fuels, essential for grant applications and environmental reporting. |
| Average Wind Speed | 6-9 m/s | Records wind speed at turbine hub height, correlating with energy potential and efficiency against weather data. |
| Response Time to Failures | < 4 hours | Measures time from failure detection to technician dispatch, minimizing downtime in community operations. |
| Member Engagement Rate | ≥ 70% | Tracks active participation in co-op events, meetings, or app usage, fostering sustained community involvement. |
| Levelized Cost of Energy (LCOE) | < $0.05/kWh | Assesses total lifetime costs divided by energy produced, demonstrating economic viability for scaling. |
| Scheduled Maintenance Compliance | ≥ 95% | Evaluates percentage of planned maintenance tasks completed on schedule, preventing unexpected outages. |
Why Community Wind Energy Project Impact Dashboard Dashboards Matter
In community wind projects, KPIs like **Turbine Availability** (≥95%) and **Carbon Savings** (≥1,000 tons/year per MW) aren't just numbers—they're proof points for sustainability and profitability. **Local Financial Returns** ($500-$2,000 per member/year) build lasting trust, while **Member Engagement Rate** (≥70%) ensures active participation for long-term success. SimpleKPI dashboards reveal trends in **Average Wind Speed** (6-9 m/s) versus **Energy Output vs Forecast** (±5% variance), empowering leaders to refine forecasts, comply with **Scheduled Maintenance** (≥95%), and keep **LCOE** under $0.05/kWh. This holistic view turns raw data into actionable insights, helping co-ops outperform targets, attract grants, and scale impact without complexity.
It balances technical metrics like **Turbine Availability** and **Plant Load Factor** with community-focused KPIs such as **Local Financial Returns** and **Member Engagement Rate**, providing a complete impact view for co-ops.
Connect SCADA systems or weather APIs effortlessly to track **Average Wind Speed**, **Energy Output vs Forecast**, and **Capacity Utilization Factor** with live updates and automated alerts.
Yes, export polished reports on **Carbon Savings**, **LCOE**, and overall performance to demonstrate environmental and financial impact to funders and authorities.