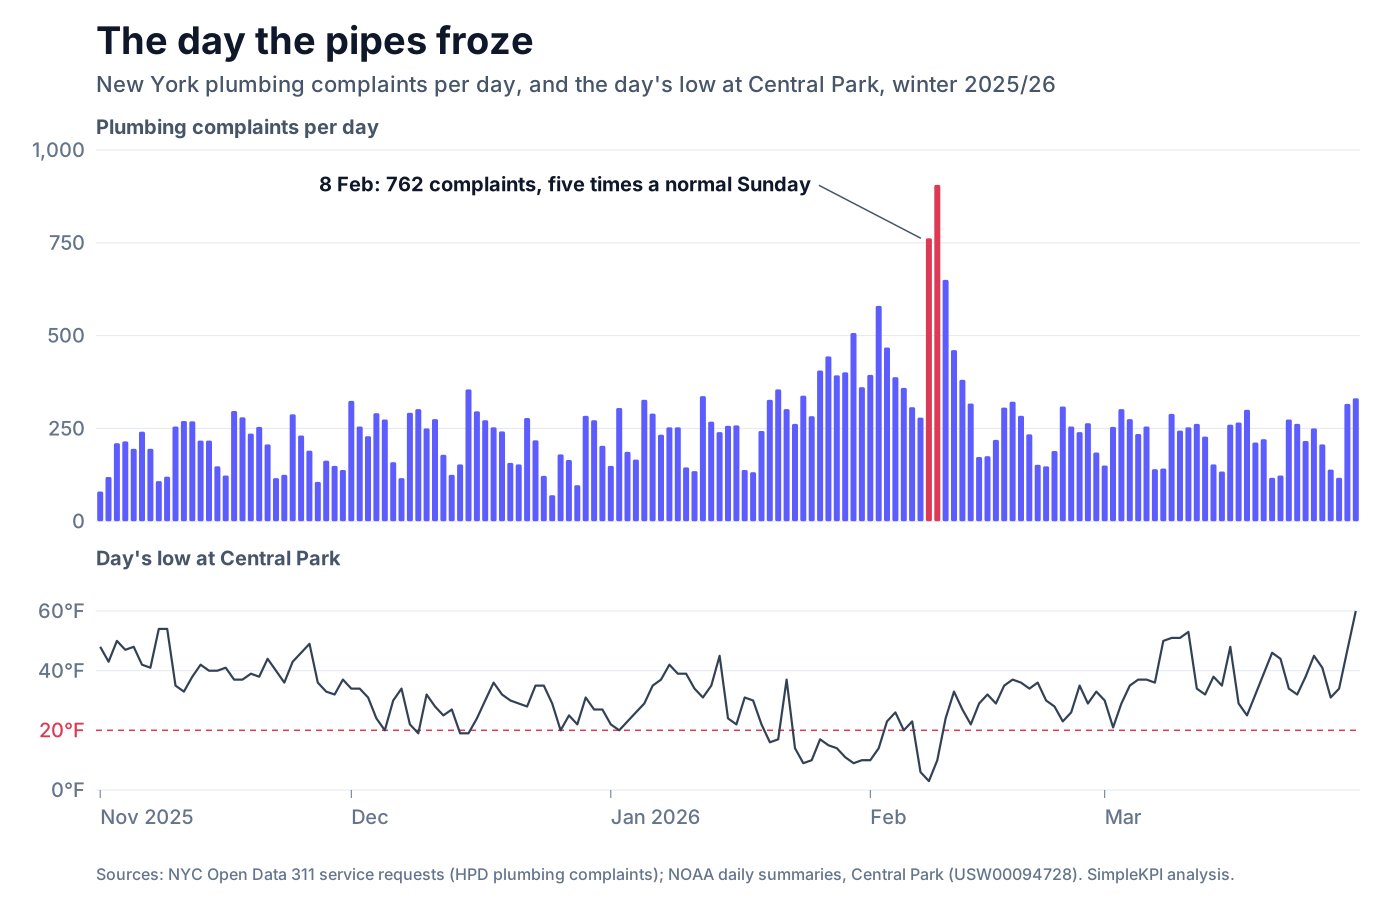
At 3°F, Sunday 8 February 2026 matched the coldest morning New York had seen since February 2023. By midnight, 762 tenants had reported a plumbing problem to the city. A normal Sunday brings about 150. On Monday, 906 more came in.
We wanted to know how predictable that was. So we took every plumbing complaint made to New York City's 311 service since January 2021, 369,822 of them, and matched each day to the temperature recorded at Central Park.
The short answer: complaints barely move until the day's low falls into the low 20s, climb once it drops below 20°F, and roughly double below 10°F. Across 11 cold snaps, the peak came the day after the first hard freeze, not on the night itself. And there's a second peak most people don't expect, in the middle of summer.
For anyone who runs a plumbing business, the useful question is when to staff up. We analyzed nearly six years of public complaint and weather records to put numbers around it. The data, and the code we used, are free to download at the end.
At a glance
- Below 20°F, complaints climb. On days with a low of 15 to 19°F they ran 18% above normal. Between 10 and 14°F, 64% above. Below 10°F, about double.
- The day after is the busiest. Across 11 cold snaps, complaints rose 41% on the first night below 15°F and 91% the day after.
- Heat waves cause a second peak. Days of 95°F or hotter ran about 70% above normal, and the highest daily total in the data came on a 100°F July day.
- Water supply complaints rise at both extremes. They're about one complaint in four on a normal day, nearly half in a freeze and nearly two in three in a heat wave.
- One cold winter can distort a whole year. Winter 2025/26 had 12 nights below 15°F. The winter before had four. January and February 2026 brought 40% more complaints than the same months of 2025.
Throughout this post, "normal" means the median number of plumbing complaints on the same weekday over the four weeks before and after a date. That takes out the big weekly rhythm in 311 reporting, where Mondays bring about twice as many complaints as Sundays.
The 20-degree line
Water freezes at 32°F, but the pipes inside a building don't, at least not straight away. Heating and moving water buy time. The question for anyone running a plumbing business is how cold it has to get before the phones start ringing.
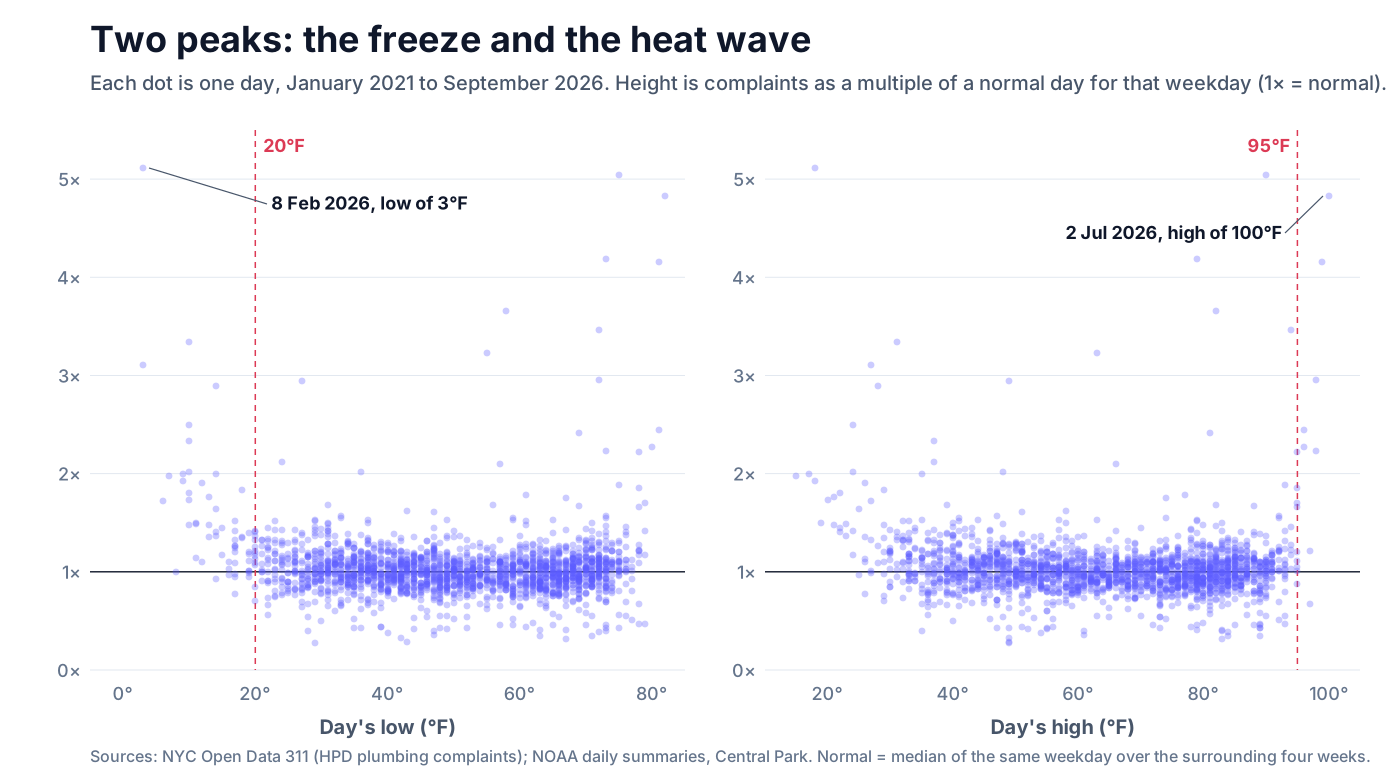
In this dataset, the pattern becomes visible below 20°F. On days when the low stayed above 25°F, complaints were indistinguishable from any other day. In the low 20s they edged up. Below 20°F they climbed, and below 15°F they jumped: 24 of the 28 days with a low under 15°F ran at least 30% above normal.
Complaints climb once the day's low falls below 20°F
New York plumbing complaints as a multiple of a normal day for that weekday, by the day's low at Central Park, January 2021 to September 2026.
- 35°F and warmer (1,664 days)1.0×
- 30 to 34°F (168 days)1.0×
- 25 to 29°F (112 days)1.0×
- 20 to 24°F (73 days)1.1×
- 15 to 19°F (27 days)1.2×
- 10 to 14°F (21 days)1.6×
- Below 10°F (7 days)2.0×
Median day in each band. Normal is the median of the same weekday over the surrounding four weeks. Source: SimpleKPI analysis of NYC Open Data 311 and NOAA daily summaries.
That lines up with the best-known rule of thumb in the trade. Field tests by the Building Research Council at the University of Illinois found that uninsulated pipes in an unheated attic started to freeze when the outside temperature fell to 20°F or below. A survey of plumbers in the same research put the start of burst-pipe trouble in the teens. Our data comes from a very different city, full of apartment blocks with central heating, and lands in the same place.
The chart below shows every day in the data, so you can see the pattern for yourself, including the second peak we'll come to shortly.
When the complaints come
Timing matters as much as temperature. If you run a plumbing company, knowing it will be busy is only useful if you know which day.
We found 11 cold snaps in the data where the low dropped below 15°F after a milder night, and lined them up by day. Complaints were already a little above normal the day before, as the temperature fell. They rose 41% on the first cold day, then peaked the day after at 91% above normal. Four days later they were still about 20% above normal.
Complaints peak the day after a cold snap starts
Median of 11 New York cold snaps, where the low fell below 15°F after a milder night, 2021 to 2026. Complaints as a multiple of a normal day for that weekday.
- The day before1.1×
- First night below 15°F1.4×
- The day after1.9×
- Two days after1.3×
- Three days after1.3×
- Four days after1.2×
Source: SimpleKPI analysis of NYC Open Data 311 and NOAA daily summaries.
Part of the reason is simple: cold snaps usually deepen. Across these 11, the second night averaged 9.8°F, colder than the first at 11.5°F. The rest is how problems get noticed. A pipe that freezes overnight is found when someone turns on a tap in the morning, and a supply line that's been frozen for a day is more likely to split.
The other peak: heat waves
Look at the right-hand half of the scatter above. We didn't expect it: the highest daily total in this dataset came in a heat wave, not a freeze. On 2 July 2026, Central Park hit 100°F and 990 complaints came in.
It wasn't a one-off. Days of 90 to 94°F were close to normal, but days of 95°F or hotter ran about 70% above it, and 10 of those 17 days were at least 30% above normal. Plotted against temperature, New York's plumbing complaints form a U-shape: flat through the mild months, rising at both extremes.
Days of 95°F or more bring a second peak
New York plumbing complaints as a multiple of a normal day for that weekday, by the day's high at Central Park, January 2021 to September 2026.
- Below 32°F (59 days)1.3×
- 32 to 49°F (447 days)1.0×
- 50 to 69°F (651 days)1.0×
- 70 to 79°F (394 days)1.0×
- 80 to 89°F (420 days)1.0×
- 90 to 94°F (84 days)1.1×
- 95°F and hotter (17 days)1.7×
Median day in each band. Source: SimpleKPI analysis of NYC Open Data 311 and NOAA daily summaries.
The complaint categories show where the rise comes from. On a normal day, water supply problems make up about a quarter of plumbing complaints, level with blocked sinks and a little ahead of baths and showers. In a freeze, they're nearly half. In a heat wave, nearly two thirds, averaging 226 a day against 46 on a normal day.
Water supply complaints rise at both extremes
Share of New York plumbing complaints about water supply, January 2021 to September 2026.
- Normal days (low of 35°F or more, high under 90°F)28%
- Freeze days (low under 15°F)47%
- Heat-wave days (high of 95°F or more)63%
Source: SimpleKPI analysis of NYC Open Data 311 complaint descriptors.
The complaint records show issue categories, not the failure behind them. A water supply complaint can come from an outage, a failed building pump, maintenance work or low pressure. In a freeze, frozen supply lines are the obvious suspect. In a heat wave, one possible explanation in tall buildings is that heavy use at the same time outruns the pumps and roof tanks that feed the upper floors. That's a hypothesis. This data can't test it.
Comparing one winter with another
The five winters in the data were very different, and that changes how the numbers should be read.
Winter 2025/26 had three times as many hard freezes as the winter before
Nights with a low below 15°F at Central Park, November to March.
- 2021/226
- 2022/235
- 2023/240
- 2024/254
- 2025/2612
Source: NOAA daily summaries, Central Park (USW00094728).
Winter 2023/24 never went below 17°F and had only two days with complaints 50% above normal. Winter 2025/26 had 12 nights below 15°F and 12 of those surge days. January and February 2026 brought 18,402 plumbing complaints, 40% more than the same two months of 2025.
That matters for anyone who judges their business by comparing each month's KPIs with the same month last year. It's usually the right comparison, and it's the one we recommend on our plumbing KPI dashboard example. But after a mild winter, a normal January looks like a boom. After a hard one, a normal January looks like a slump. Without the weather next to the numbers, you can't tell a better business from a colder winter.
What this means if you run a plumbing company
A freeze hits three plumbing KPIs first: call booking rate, emergency response time and first-time completion. I've spent almost 20 years helping businesses decide which numbers to watch. The mistake I see most often is reacting to what already happened: last month's revenue, last week's missed calls. Weather is one of the few things that tells you what's about to happen, and it's free. Here's how I'd use it.
- Staff for the day after, not the night of. When the forecast shows a low below 20°F, put extra call cover in place for the following day. Your call booking rate is where a missed freeze shows first: every unanswered call is a customer ringing someone else.
- Have the on-call rota ready before the cold arrives. Emergency response time is the number customers remember, and the stakes are real. State Farm alone paid more than 20,000 frozen pipe claims from 2024 through June 2025, averaging over $30,000 each.
- Stock the trucks for water supply work. In both peaks, water supply problems make up nearly half the complaints or more. The parts you'll need are predictable, and first-time completion falls fast when a truck runs out.
- Plan for 95°F too. If you work on multi-family or commercial buildings, water supply complaints rise in a heat wave as well, at a time of year when most plumbing companies expect things to be quiet.
- Put the weather on your dashboard. Track the day's low and high as KPIs next to your call and booking numbers. Then a slow January can be judged against the weather, not just against last January.

What 311 can't tell you
This data has limits, and it's worth being clear about them.
- These are tenants, not plumbers' phones. Every one of these complaints went to the city's housing department, from people renting their homes. They show when problems happen, not how many calls a plumbing company takes.
- New York isn't everywhere. A city of apartment blocks with central heating behaves differently from a suburb of single-family homes with pipes in crawl spaces and garages. We'd expect the freeze threshold to be higher, not lower, in older homes with exposed pipes.
- Holidays run the other way. Roto-Rooter says the day after Thanksgiving brings a 50% spike in service calls. In New York's 311 data, complaints fall to less than half of normal on Thanksgiving itself and 60 to 80% of normal the day after, every year. People call a plumber or the super on a holiday weekend, not the city.
- Not every spike is the weather. A handful of the biggest days, such as 22 August 2022 and 15 April 2024, came on otherwise ordinary days. The data doesn't say why. A water main break or a supply outage would look exactly like this.
- This shows a pattern, not a cause. The link between cold and complaints is strong and consistent, but temperature is standing in for a lot of things that happen at the same time.
How we did it
We used two public data sets. The first is New York City's 311 service requests, filtered to the "Plumbing" complaint type, all of which are handled by the Department of Housing Preservation and Development. The second is NOAA's daily summaries for Central Park, station USW00094728.
The window runs from 1 January 2021 to 22 September 2026: 369,822 complaints over 2,086 days with both complaint and temperature records. Complaints follow a strong weekly rhythm, with Mondays averaging about twice as many as Sundays, and they've grown over time. So rather than compare raw counts, we compared each day with a normal day for that weekday: the median of the same weekday over the four weeks either side. That left 2,072 days with a full comparison. A value of 2.0× means twice as many complaints as normal. It's the same principle behind anomaly tracking in KPI Insights, which flags numbers that break a KPI's usual pattern, not just the ones that miss a target.
Temperature bands use the day's low or high in whole degrees Fahrenheit, and each band shows its median day, so a single extreme day can't drag the result. Cold snaps are days when the low fell below 15°F after a night at or above it.
Download the data
The full daily data set is free to use: nyc-plumbing-complaints-vs-temperature-2021-2026.csv. It has one row per day with plumbing complaints, the normal for that weekday, the ratio between them, the day's low, high, rain and snow, and complaints split by type.
The code is here too: nyc-plumbing-complaints-vs-temperature-analysis.py. It downloads both data sets from their public sources and rebuilds the file and every figure in this post. It needs Python and nothing else.
If you use it, please cite: SimpleKPI analysis of NYC Open Data 311 service requests and NOAA daily summaries for Central Park, 2021 to 2026, simplekpi.com/blog/when-do-pipes-freeze-new-york-data.
What we changed. We downloaded the 311 records on 27 September 2026, kept the "Plumbing" complaint type, and counted complaints per day, in total and by type. The normal_for_weekday and ratio_to_normal columns are our own calculation. The temperature, rain and snow figures are NOAA's, as published.
Sources. NYC Open Data, 311 Service Requests from 2010 to Present (data set erm2-nwe9). Menne, M. J., I. Durre, B. Korzeniewski, S. McNeill, K. Thomas, X. Yin, S. Anthony, R. Ray, R. S. Vose, B. E. Gleason and T. G. Houston (2012): Global Historical Climatology Network - Daily (GHCN-Daily), Version 3, NOAA National Centers for Environmental Information, station USW00094728.
Licence. You're free to use, share and adapt the file for any purpose, including commercially, under a Creative Commons Attribution 4.0 licence, as long as you credit SimpleKPI with the citation above.
No warranty. The data is provided as is. Neither SimpleKPI, the City of New York nor NOAA guarantees that it is complete or accurate, and neither the City nor NOAA endorses this analysis.

Water freezes at 32°F, but pipes inside a building rarely freeze until it is much colder outside. Field tests by the Building Research Council at the University of Illinois found uninsulated pipes in an unheated attic started to freeze when the outside temperature fell to 20°F or below. New York's plumbing complaints tell the same story: they barely move until the day's low falls into the low 20s, climb once it drops below 20°F, and roughly double below 10°F.
In New York, yes. On days that reached 95°F or hotter, plumbing complaints to the city ran about 70% above normal, and the highest daily total since 2021 came on 2 July 2026, when the high hit 100°F and 990 complaints came in. Nearly two in three of those heat-wave complaints were about water supply, compared with about one in four on a normal day.
Plan from the three-day forecast. In New York, complaints rose about 40% on the first day the low fell below 15°F and peaked the day after at almost double normal, and stayed above normal for several days after that. So when a low below 20°F is forecast, put extra call cover and an on-call rota in place for the day after it, not just the night itself.
Start with the three a freeze hits first: call booking rate, because every unanswered call in a cold snap is a customer ringing someone else; emergency response time, the number customers remember; and first-time completion, which falls fast when trucks run short of parts. Track the day's low as a KPI beside them, so each week can be judged against the weather as well as against the same week last year. Our plumbing KPI dashboard example shows all nine KPIs a plumbing company should watch, with targets.
For drain and sewer companies, yes. Roto-Rooter says the day after Thanksgiving brings a 50% spike in service calls, its busiest day of the year. New York's 311 plumbing complaints do the opposite and fall to well below normal over the holiday, because tenants call their superintendent or a plumber, not the city, when a drain blocks on a holiday weekend.
Turn KPIs like these into live dashboards for field service teams, and pay one flat price: $79 a month for unlimited users and KPIs. There is a 14-day free trial, no card needed.