March 2016 Update: Dashboard Boost
With this release you can now do more with your Dashboards. We've introduced the ability to add Reports to your dashboards, a new dashboard chart type and an all new full screen presentation mode.Great for large screen TVs, boardrooms or presentations.
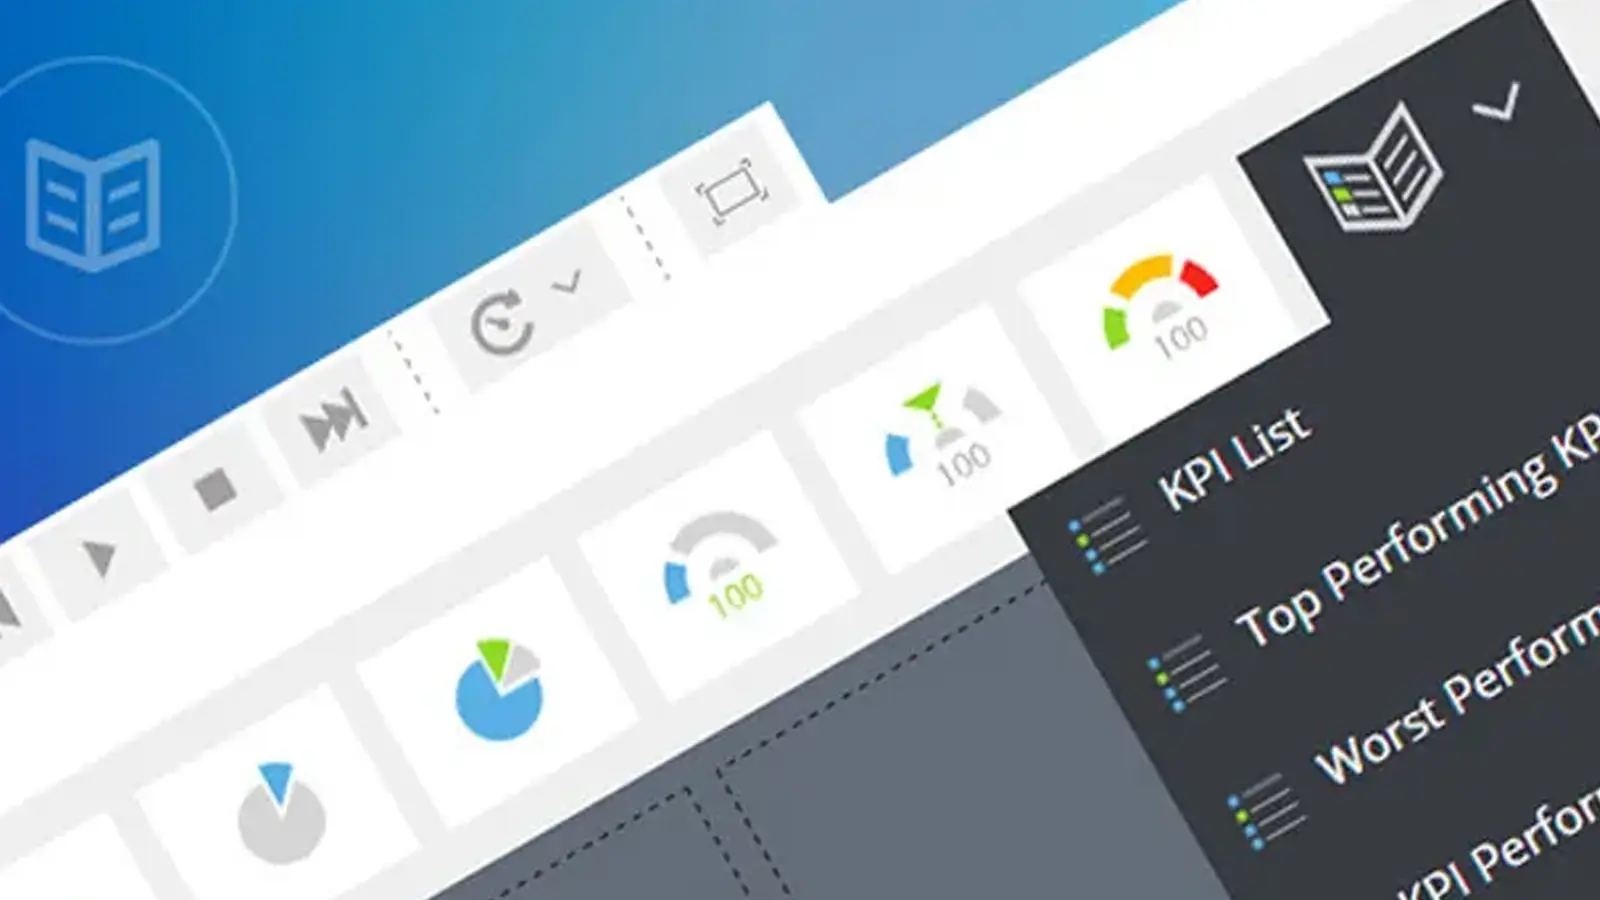
New Dashboard Charts
This update adds a new single column graph for quickly visualizing how any of your users or groups contribute to the value of a KPI.
Presentation Mode.
Any of your dashboards can now be viewed in full screen mode allowing more charts and graphs to be visible at any one time. In addition, dashboards can now be rotated automatically at regular time intervals.
Reports
The entire collection of standard reports can now be added to Dashboards to improve your KPI visibility. Choose from over 10 reports with the ability to filter by KPIs, Users and dates.
You can find out about this latest dashboard update along with many other new features on the support portal.
More performance insights, Templates and KPIs can be found by visiting KPI Central.

by Paulo De Sousa
Paulo writes on the technical side of KPI Tracking. He is a co-founder of SimpleKPI and has worked in the development and SaaS field for over 20 years. He is passionate about helping businesses make data-driven decisions through the use of data, reports, and analytics. With his deep understanding of business intelligence tools, he's adept at providing solutions that can help businesses reach their goals.