We’ve been busy with more than just strengthening our product with speed optimization this month; we have also strengthened the dashboard with a new set of Gauges.
Dashboard gauges allow you to take complex data sets and visualize metrics and KPIs in a meaningful and simplified way. Gauges are probably the most visual of all dashboard elements and are perfect for seeing progress towards goals, RAG indicators and simplified sales targets.
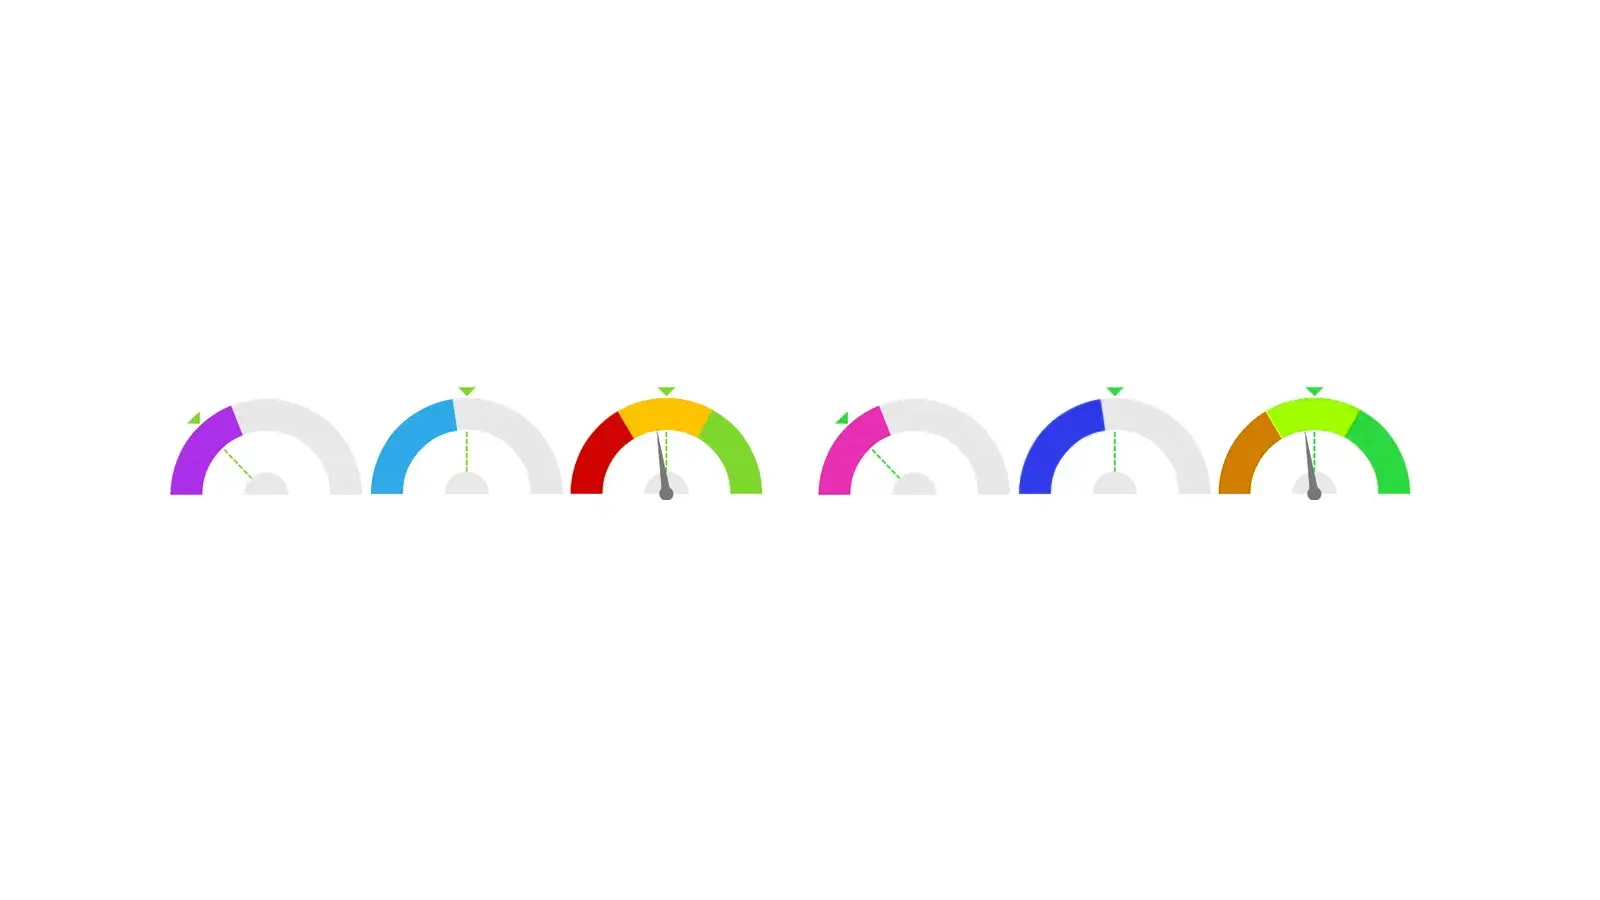
You can now choose from three NEW types of Gauges:
Update: All Gauges can now use the colour pallete to customize targets, actuals and RAG colours.
- The standard Gauge for KPI tracking against a target.
- The Goal Based Gauge to visualise progress towards a time based goal.
- The threshold, or RAG Gauge for setting Red, Amber and Green indicators against your KPIs.
We'd love to hear feedback on this and any of our updates.
More information about these new chart types can be found at support.simplekpi.comMore performance insights, Templates and KPIs can be found by visiting KPI Central.

by Stuart Kinsey
Stuart Kinsey writes on Key Performance Indicators, Dashboards, Marketing, and Business Strategy. He is a co-founder of SimpleKPI and has worked in creative and analytical services for over 25 years. He believes embracing KPIs and visualizing performance is essential for any organization to strive and grow.