February 2017 Update: New trend graphs
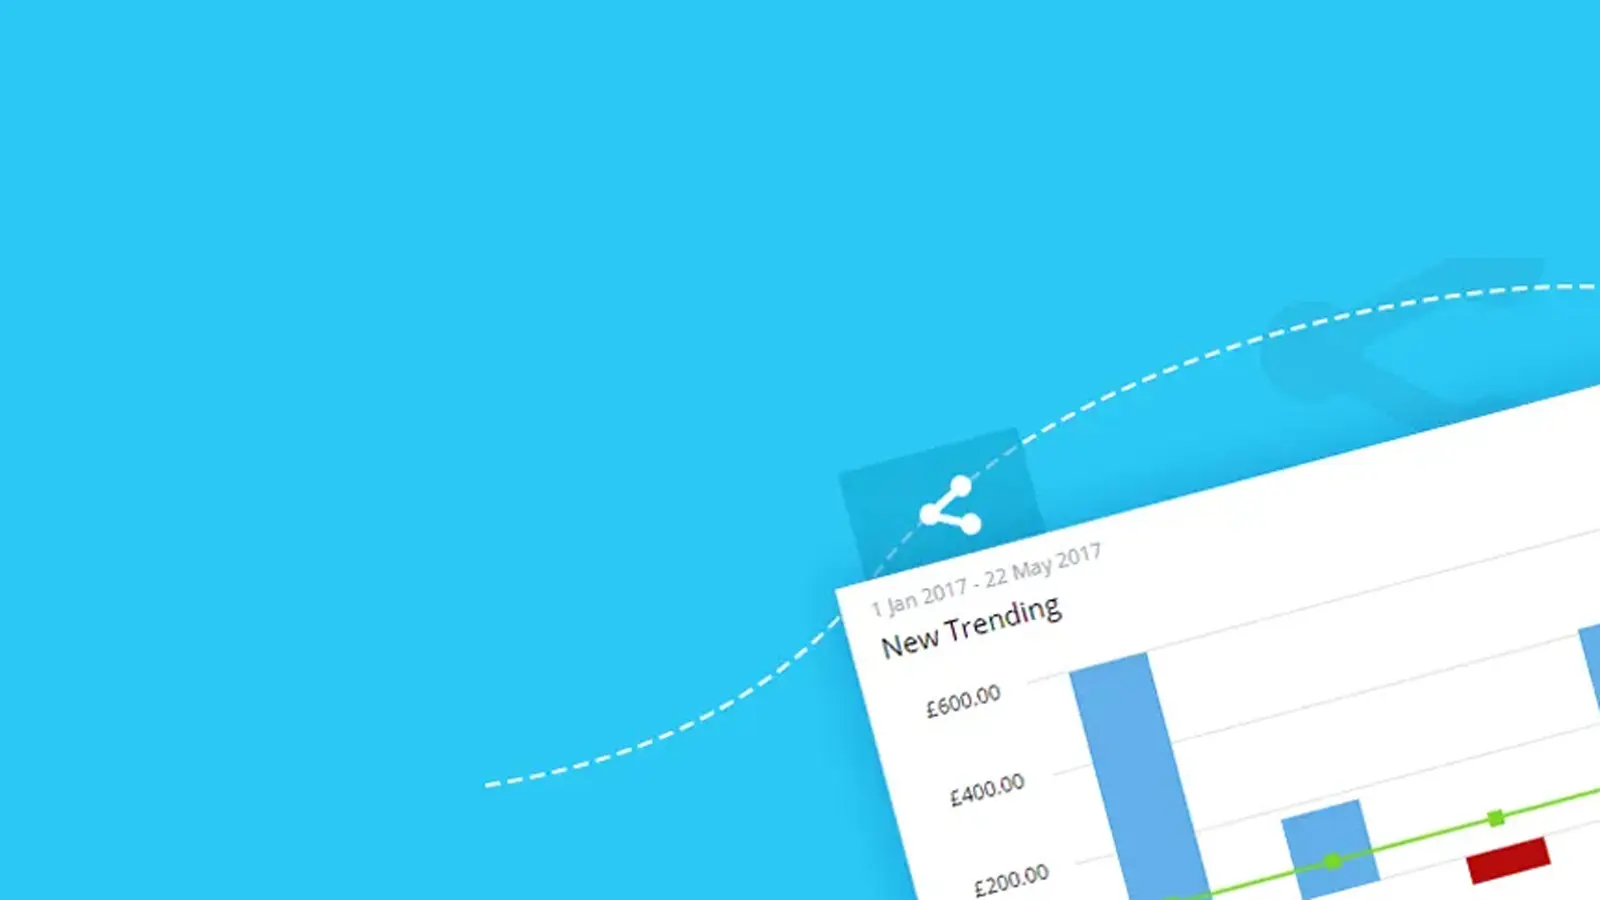
We’re continuing to invest heavily in our product updates and in this release, we have added some new trend graphs so you can now visualize your data by various groups users or dates. Then once you’ve done you can now share individual graphs on your website by using the new embedding feature.
The benefit of a KPI trend graphs is that you can very quickly determine performance against target, but more importantly they can show historic trends that can provide valuable insights into potential issue or opportunities.
With the new trend graphs your able to now customize the graph with your own colour scheme to help you spot even the subtlest of trend changes. And with all the new graph updates you can share, copy and embed them on your own website.
We’ve also been focusing on visualizing the application across even more mobile devises.
More performance insights, Templates and KPIs can be found by visiting KPI Central.

by Paulo De Sousa
Paulo writes on the technical side of KPI Tracking. He is a co-founder of SimpleKPI and has worked in the development and SaaS field for over 20 years. He is passionate about helping businesses make data-driven decisions through the use of data, reports, and analytics. With his deep understanding of business intelligence tools, he's adept at providing solutions that can help businesses reach their goals.