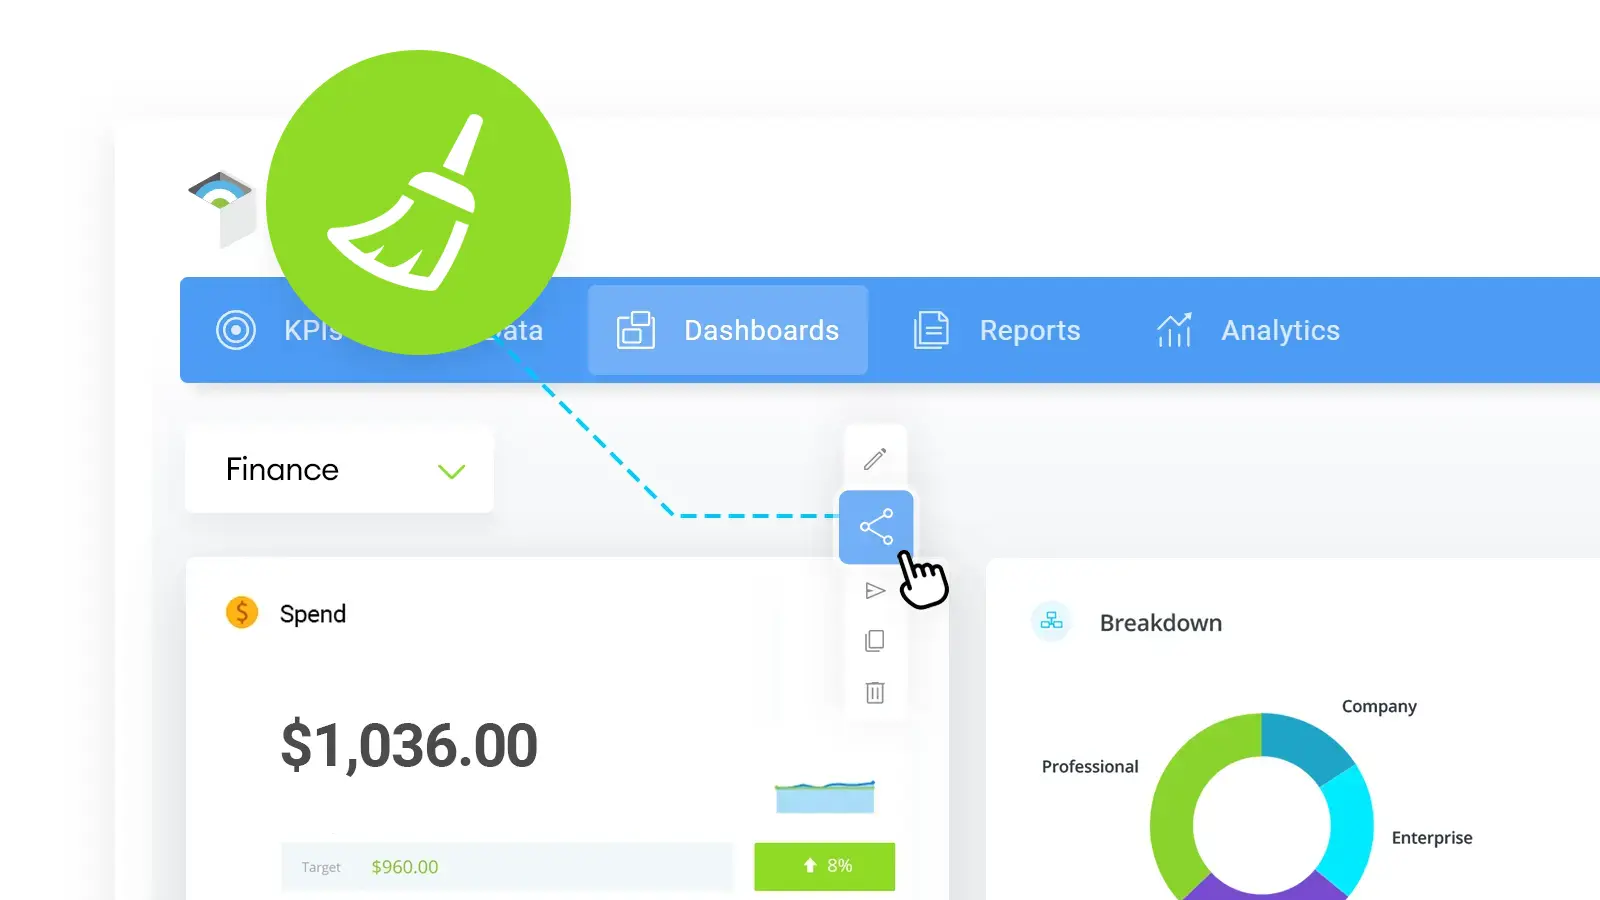
A KPI Dashboard provides a great way of visualising metrics by using graphs, gauges, and other data driven tools. With something so simple and powerful the temptation is always there to visualise everything and everyone. We have put together our top 4 dashboard clean-up recommendations.
• Display only Key Performance Indicators – a dashboard should be lean and mean - it’s not for every metric imaginable, try reducing your current KPIs to the bare minimum, it’s also good practice to spring clean your KPIs often to prevent the number increasing over time.
• Tell a story – organize the dashboard views to follow a natural and logical flow of data, this will help others understand and follow the data more logically.
• If you don’t need to view this data once a day / week, do you really need it on the dashboard? Maybe creating KPI reports instead may be more beneficial.
• Am I seeing the same data twice, is the data appearing in another table or graph.
New to KPI Dashboards? Learn more here

by Paulo De Sousa
Paulo writes on the technical side of KPI Tracking. He is a co-founder of SimpleKPI and has worked in the development and SaaS field for over 20 years. He is passionate about helping businesses make data-driven decisions through the use of data, reports, and analytics. With his deep understanding of business intelligence tools, he's adept at providing solutions that can help businesses reach their goals.