
Marketing KPIs
Welcome to our comprehensive exploration of the 28 Must-Have Marketing KPIs that are pivotal for navigating the complex waters of modern-day marketing.
From the viral potential of Social Media KPIs to the strategic allocation of the Marketing Budget, the operational efficiency of your campaigns, the reach and engagement of Email Marketing, and the critical analysis of Website Conversions — each category serves as a beacon to illuminate the path to achieving your marketing objectives.
We’ll delve into these categories, providing you with the insights to measure, analyze, and optimize your marketing efforts for unparalleled growth and effectiveness.
What are Marketing KPIs?
Marketing Key Performance Indicators (KPIs) are quantifiable metrics that facilitate tracking and measuring the success of marketing activities. These indicators align with the company's strategic goals and provide insights into the efficiency of marketing campaigns, strategies, and tactics.
Marketing KPIs serve as a navigational tool, guiding marketing professionals through the vast sea of data to pinpoint what truly matters for business growth. They enable marketers to assess their efforts' return on investment (ROI), understand customer engagement levels, and make informed decisions to optimize marketing performance.
By focusing on the right marketing KPIs, businesses can ensure that every marketing dollar spent contributes to the overarching objectives, whether increasing brand awareness, generating leads, or driving sales.
In essence, marketing KPIs are the vital signs of a company's marketing health, providing a clear image of what's working and what needs adjustment.
Marketing KPI Benefits
Tracking Marketing KPIs provides tangible business benefits, such as:
Measure Effectiveness:
KPIs clearly measure how well your marketing strategies and campaigns perform against your objectives. They help you understand the impact of your marketing efforts on your business goals.
Optimize ROI:
By analyzing KPIs, you can identify which marketing activities yield the best return on investment. This enables allocation of resources more effectively and maximize the ROI of your marketing budget.
Improve Decision-Making:
With real-time data from KPIs, you can make informed decisions quickly. This agility allows you to adjust your strategies to market trends and customer behaviors.
Enhance Accountability:
KPIs set clear expectations for your marketing team. When everyone knows what metrics they're responsible for, it fosters a culture of accountability and drives performance.
Gain Competitive Advantage:
Understanding your marketing KPIs can give you an edge over competitors. It allows you to capitalize on successful tactics and refine or abandon underperforming ones.
Justify Marketing Spend:
KPIs help justify the marketing budget to stakeholders by showing the tangible results of marketing investments. This transparency builds trust and supports future budget approvals.
28 Marketing KPIs
These marketing KPIs are divided into the following categories:
Social Media KPIs
Social media KPIs reveal how effectively your content resonates with your audience, from engagement rates to follower growth. By tracking these indicators, you can steer your social strategy toward success.
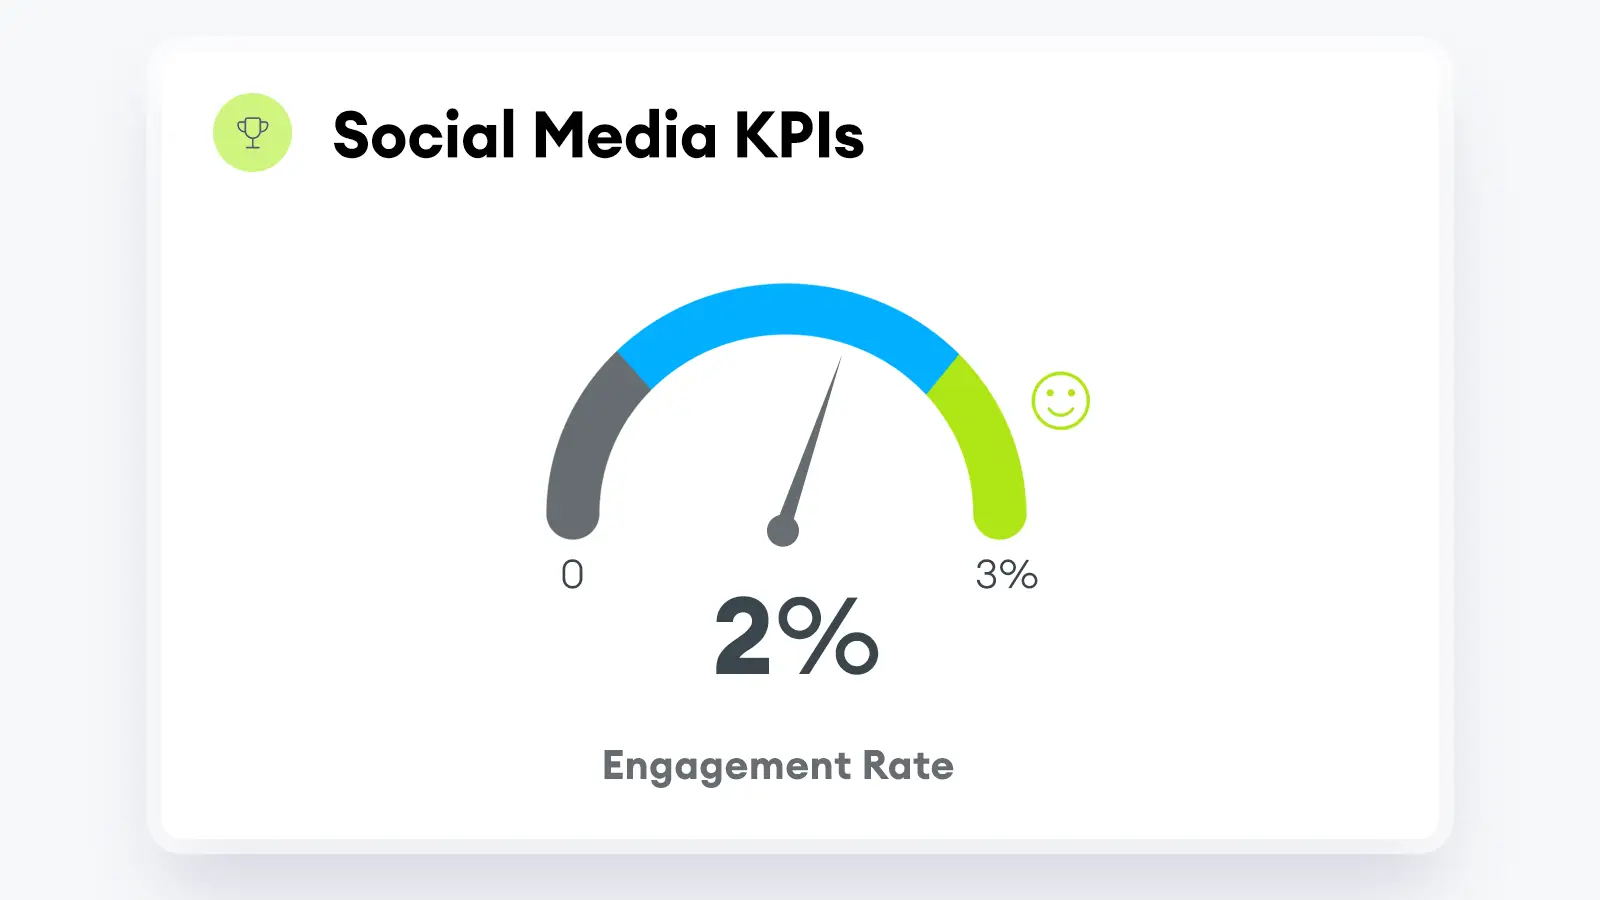
1. Engagement Rate
- Description: Measures the level of engagement that content receives from the audience.
- Formula: Divide the number of engagements (likes, shares, comments, reactions.) by the total number of followers.
- Example: Suppose a post receives 200 engagements and the account has 10,000 followers. So, the Engagement Rate for that post is 2%.
2. Click-Through Rate (CTR)
- Description: The percentage of people who clicked on a link out of the total who viewed the post.
- Formula: The total number of clicks divided by the total impressions.
- Example: A campaign with 500 clicks and 10,000 impressions has a CTR of 5%.
3. Followers Growth Rate
- Description: Measures how quickly your follower base is expanding over a specific period. It reflects the rate at which new followers are joining your social media account or platform.
- Formula:(New followers - Lost followers)/Followers at the beginning *100.
- Example: Suppose your social media account starts with 10,000 followers. Over the next month, you gain 500 new followers and lose 100 followers. Your growth Rate is 4%.
4. Social Share of Voice (SSoV)
- Description: Tracks brand visibility by measuring the number of times a brand is mentioned on social media compared to competitors.
- Formula: Brand Mentions / Total Industry Mentions *100.
- Example: If a brand has 500 mentions out of 5,000 industry mentions, the SSoV is 10%.
5. SM Conversion Rate
- Description: Measures the percentage of users who take a desired action via SM, such as making a purchase or filling out a form.
- Formula: Number of Conversions / Total Visitors * 100.
- Example: If 50 out of 1,000 visitors click the desired action, the conversion rate is = 5%.
6. Customer Sentiment
- Description: Evaluates how customers perceive your brand or product based on social media conversations (positive, negative, or neutral).
- Measurement: It can be measured on a scale between positive and negative or expressed as specific emotions (e.g., angry, frustrated, happy).
- Example: Positive sentiment: “The food was amazing!” Negative sentiment: “Service was slow and disappointing.” Neutral sentiment: “It was an okay experience.
7. Post Reach
- Description: Measures the total number of unique users that have been exposed to a social media post, article, or campaign.
- Formula: Number of Post Reach / Total followers *100.
- Example: For example, if a post reaches 500 people and you have 1,000 followers = 50%.
Marketing Budget KPIs
Organizations use Marketing Budget KPIs (Key Performance Indicators) to evaluate the impact of marketing activities. These KPIs help professionals monitor the success of different marketing channels and determine efficient budget spending strategies.
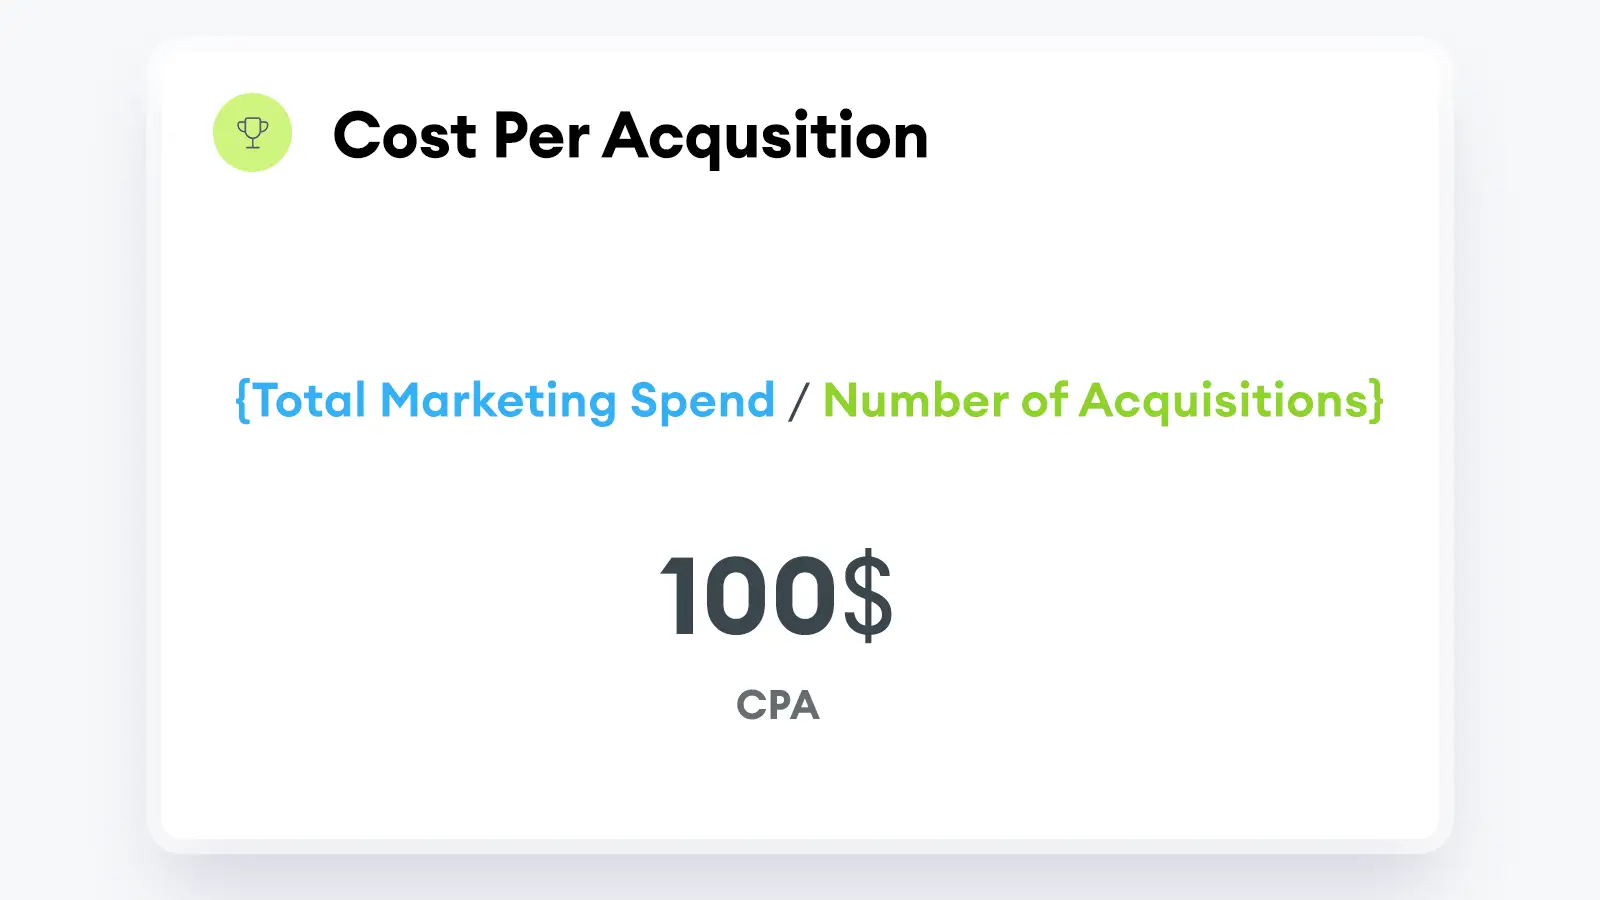
8. Cost Per Acquisition (CPA)
- Description: The cost incurred to acquire one paying customer.
- Formula: Total Marketing Spend / Number of Acquisitions.
- Example: Spending $5,000 on a campaign that results in 50 acquisitions has a CPA of $100.
9. Return on Marketing Investment (ROMI)
- Description: The return gained from marketing investments.
- Formula: (Revenue Attributable to Marketing - Marketing Spend) / Marketing Spend *100.
- Example: Let’s say you spent $10,000 on a campaign and generated $50,000 in revenue. This is a ROMI of 400%, or 4$ for every dollar invested.
10. Marketing Percentage of Customer Acquisitions Cost (M-CAC)
- Description: Shows the marketing portion of the total CAC.
- Formula: Marketing Spend / Total Acquisition Cost * 100.
- Example: If the marketing spend is $2,000 out of a total acquisition cost of $8,000 then the percentage of Marketing CAC is 25%.
11. Budget Variance
- Description: Measures the difference between the budgeted amount and the actual amount spent.
- Formula: Budgeted Amount - Actual Amount.
- Example: If the budgeted amount is $10,000 and the actual spend is $9,500, the variance is $10,000 - $9,500 = $500.
12. Cost Per Lead (CPL)
- Description: The cost of generating a new lead for the business.
- Formula: Total Marketing Spend / Number of leads generated.
- Example: If $2,000 is spent to generate 100 leads, the CPL is = $20.
13. Marketing Efficiency Ratio
- Description: Assesses the efficiency of marketing spend relative to revenue generated.
- Formula: Revenue / Marketing Spend.
- Example: A revenue of $100,000 from a marketing spend of $10,000 gives an efficiency ratio of = 10.
14. Average Order Value (AOV)
- Description: The average amount spent each time a customer places an order.
- Formula: Total Revenue / Number of Orders.
- Example: If total revenue is $5,000 from 100 orders, the AOV is = $50.

Email Marketing KPIs
Email Marketing KPIs are used to track and evaluate how effective your email marketing efforts have been. The following KPIs provide insights into various aspects of your email campaigns.
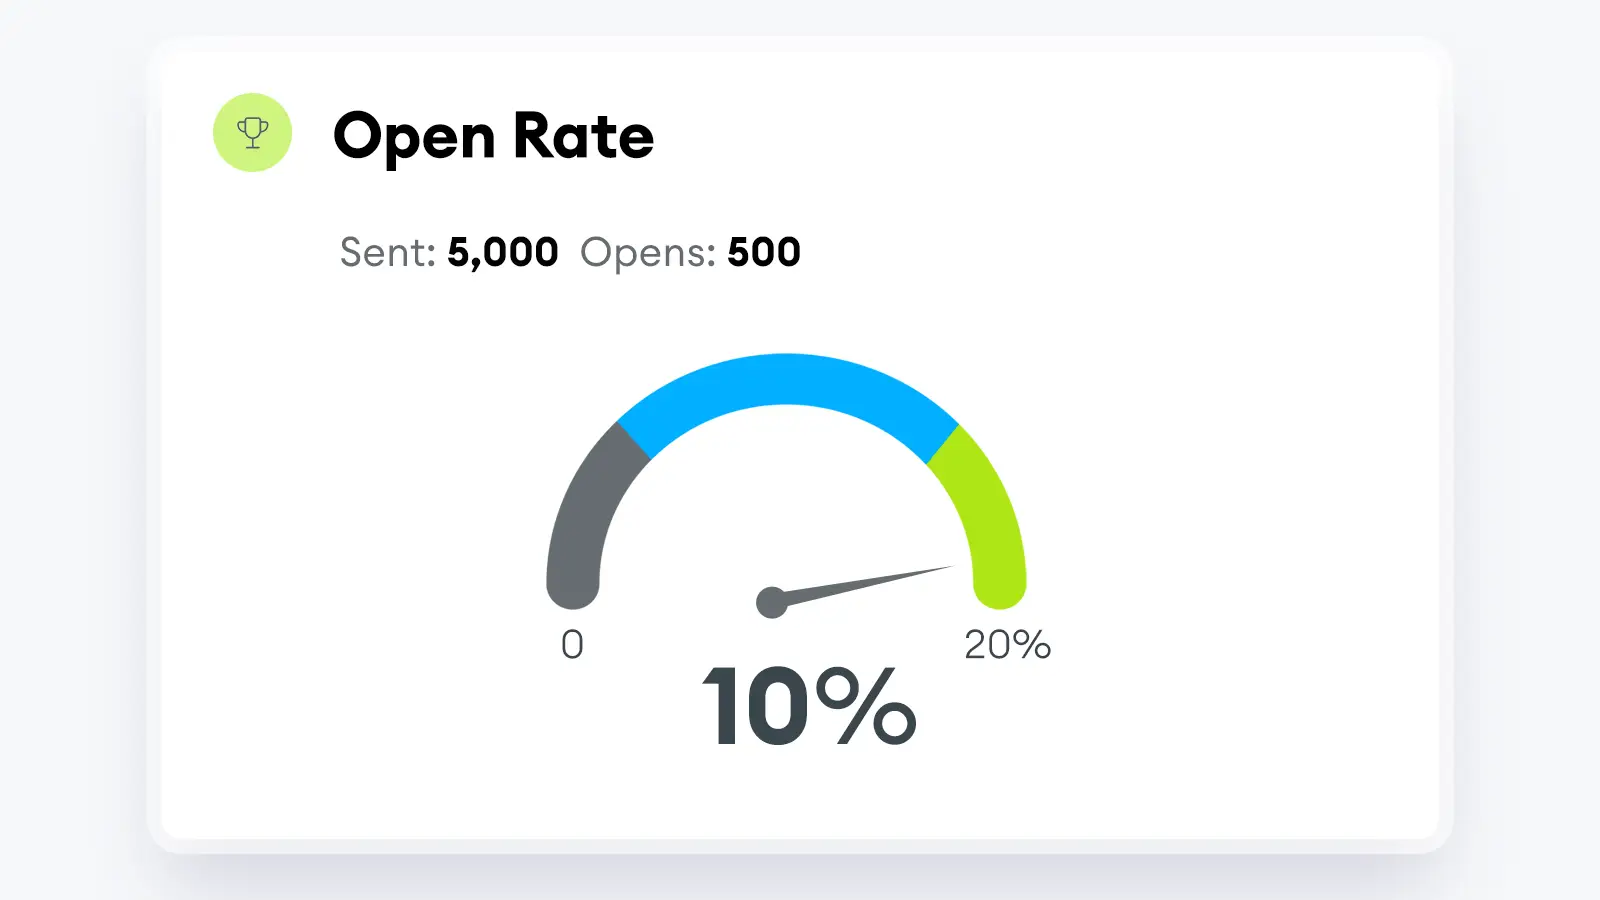
15. Open Rate
- Description: The percentage of email recipients who open a given email.
- Formula: The number of emails open / Total number of emails sent.
- Example: 500 opens out of 5,000 emails sent results in an Open Rate of = 10%.
16. Bounce Rate
- Description: The percentage of emails that could not be delivered to the recipient's inbox.
- Formula: Number of bounced emails / Total number of emails sent *100.
- Example: If 20 out of 1,000 emails bounce, the rate is = 2%.
17. Email List Growth Rate
- Description: Measures how quickly the email list is growing.
- Formula: New Subscribers - Unsubscribes / Total number of subscribers * 100.
- Example: If the list grows by 100 but 10 unsubscribe, from a list of 2,000, the growth rate is = 4.5%.
18. Click to sale conversion rate
- Description: The percentage of clicks that become paying customers.
- Formula: Number of Sales / Number of Leads * 100.
- Example: If 10 out of 100 clicks result in sales, the conversion rate is = 10%.
19. Email Deliverability Rate
- Description: Measures the ability to deliver emails to subscribers’ inboxes successfully.
- Formula: The number of emails delivered to the inbox / number of emails delivered * 100.
- Example: Factors affecting deliverability include custom authentication, opt-in methods, and engagement levels.
20. Unsubscribe Rate
- Description: Indicates the percentage of recipients who unsubscribed from your emails.
- Formula: Number of emails sent / Number of Unsubscribes *100.
- Example: Sending out 1,000 marketing emails in a month. Of which, 30 recipients clicked the “unsubscribe” link to opt out of future emails, resulting in a 3% unsubscribe rate.
21. Inbox Placement Rate
- Description: Tracks what happens to an email after it’s successfully delivered. It answers questions like: Did the email land in the primary inbox, promotions tab, or spam folder?
- Formula: Emails in primary mailbox / total emails delivered.
- Example: Suppose you sent out 1,000 emails. Out of those, 900 landed in recipients’ primary inboxes, while 100 ended up in promotions or spam folders. this would indicate an IPR of 90%.

Website Marketing KPIs
Email Marketing KPIs are used to track and evaluate the effectiveness of your email marketing efforts. The following KPIs provide insights into various aspects of your email campaigns.
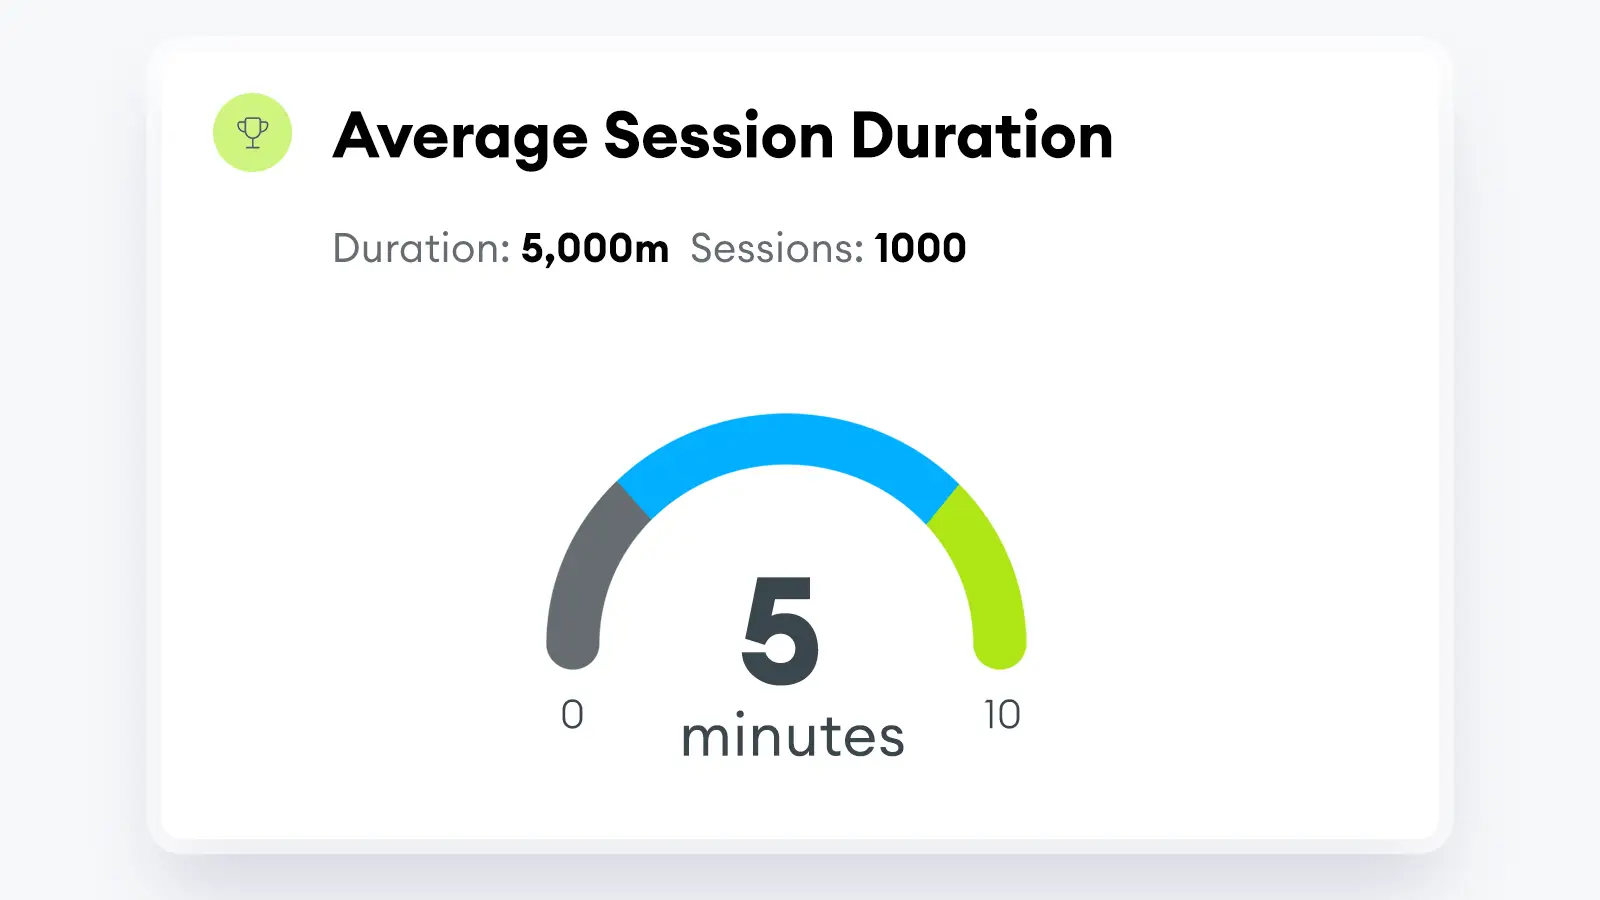
22. Average Session Duration
- Description: The average length of a session on your website.
- Formula: Total Duration of All Sessions / Total Sessions.
- Example: If users spend a total of 5,000 minutes on a site over 1,000 sessions, the Average Session Duration is = 5 minutes.
23. Conversion Path Length
- Description: The average number of interactions before a conversion.
- Formula: Total Interactions / Number of Conversions.
- Example: If there are 300 interactions for 30 conversions, the path length is = 10 interactions.
24. Organic Traffic
- Description: The number of visitors that come to your website from unpaid sources.
- Formula: Total Traffic - Paid Traffic.
- Example: **: If a website receives 1,000 visitors, with 300 from paid ads, organic traffic is 1,000 - 300 = 700 visitors.
25. Mobile Traffic Conversion Rate
- Description: The percentage of visitors from mobile devices that complete a desired action.
- Formula: Number of mobile conversions / total mobile traffic *100.
- Example: If there are 50 conversions from 1,000 mobile visitors, the conversion rate is = 5%.
26. Page Views per Visit
- Description: The average number of page views during a session.
- Formula: Total Page Views / Total Visits.
- Example: If there are 1,000 page views across 200 visits, the average is = 5 page views per visit.
27. Shopping Cart Abandonment Rate
- Description: The rate at which customers add items to a shopping cart but do not complete the purchase.
- Formula: Number of completed transactions / Number of shopping carts created * 100.
- Example: If 60 transactions are completed out of 200 carts created, the abandonment rate is = 30%.
28. Page Load Speed
- Description: Measures how quickly your web pages load.
- Formula: No single formula exists, but Google's page speed insights can track this KPI.
- Example: Suppose you find that the average page load time across all pages is 0.5 seconds. This can indicate that your website is performing well in terms of speed.

by Stuart Kinsey
Stuart Kinsey writes on Key Performance Indicators, Dashboards, Marketing, and Business Strategy. He is a co-founder of SimpleKPI and has worked in creative and analytical services for over 25 years. He believes embracing KPIs and visualizing performance is essential for any organization to strive and grow.