What is a Supply Chain KPI Dashboard?
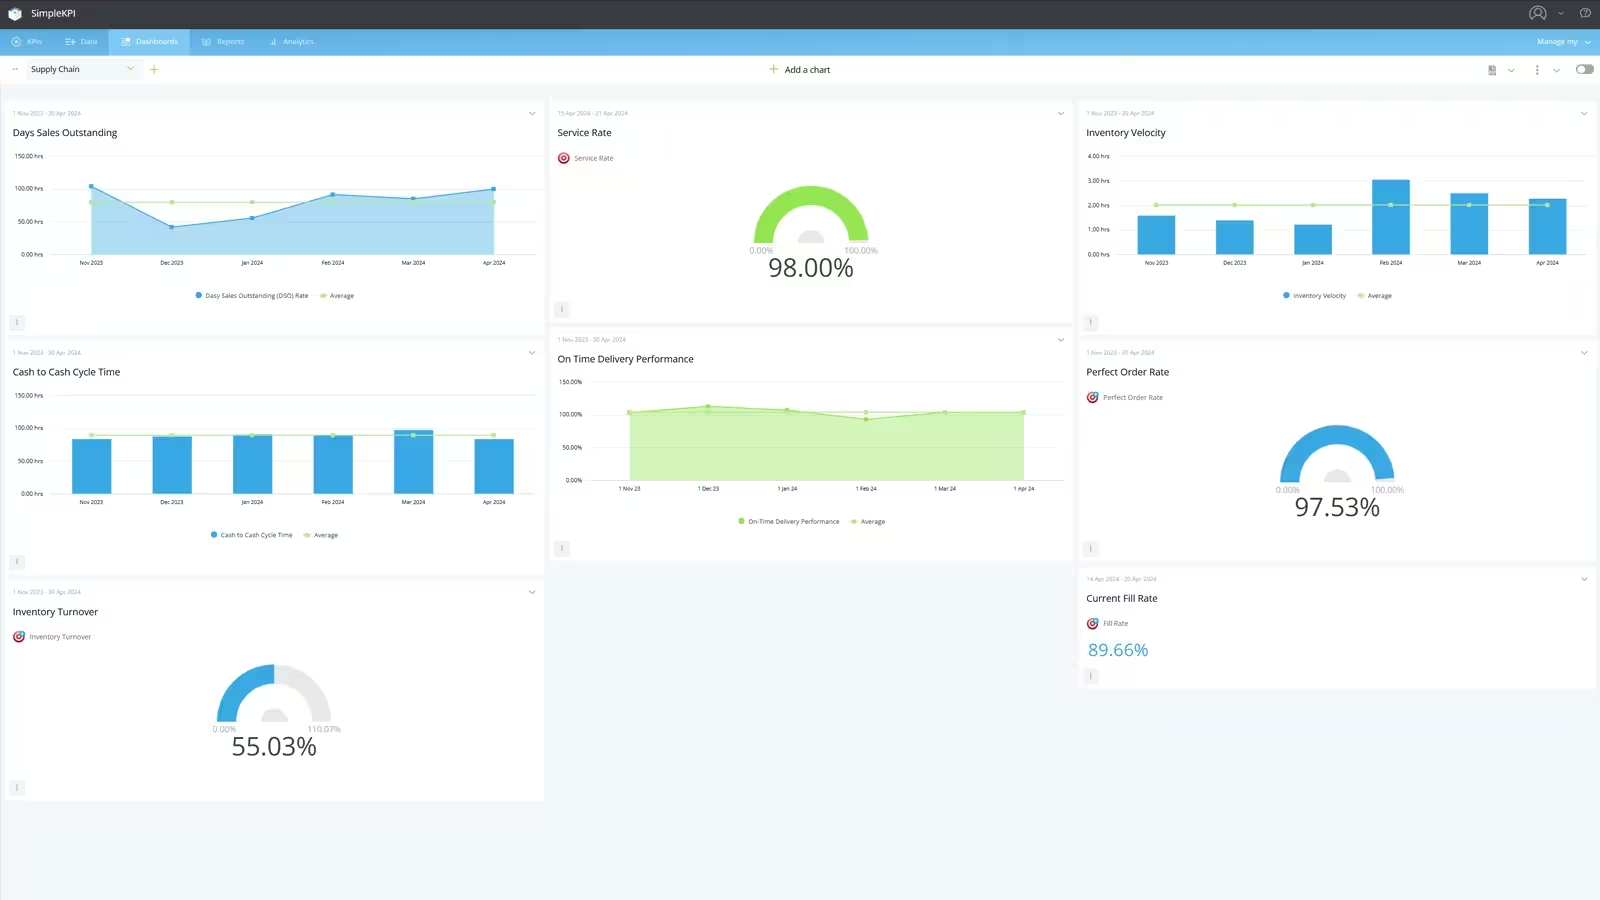
A Supply Chain KPI Dashboard is a powerful tool designed to provide supply chain professionals with real-time insights into critical performance metrics. It consolidates data from various stages of the supply chain such as Cash to Cash Cycle time and Service Rate, transforming it into visual representations such as charts, graphs, and tables.
The Key features of this dashboard include:
- KPI Tracking: Monitors essential indicators related to inventory management, production efficiency, transportation, and procurement.
- Visibility: Offers a holistic view of supply chain operations, enabling informed decision-making.
- Actionable Insights: Identifies bottlenecks, risks, and growth opportunities.
- User-Friendly Interface: Presents complex data in an easily digestible format.
Why choose this supply chain dashboard?
This dashboard has been developed specifically to help supply chain managers and teams keep track of their KPIs. It has been tailored to address the unique challenges faced by supply chain management. With real-time monitoring, the dashboard provides up-to-the-minute data, allowing users to stay ahead of the curve.
Timely insights empower you to manage your supply chain proactively. You can customize the dashboard to suit your organization's specific needs, whether you're tracking inventory turnover, lead times, or supplier performance.
The dashboard supports strategic decision-making by providing informed decisions based on trends, anomalies, and performance benchmarks. It provides all the information you need to make data-driven decisions and ensure your supply chain runs smoothly.
Who is this dashboard for?
- Supply Chain Managers: Gain a comprehensive overview of operations, identify areas for improvement, and optimize resource allocation.
- Procurement Teams: Monitor supplier performance, track order fulfillment, and negotiate better terms.
- Logistics Professionals: Keep tabs on transportation efficiency, delivery times, and warehouse utilization.
- Executives and Stakeholders: Access high-level summaries and strategic insights for informed decision-making.
What problems is this dashboard trying to address?
- Lack of Visibility: Traditional supply chain management often lacks real-time visibility into critical metrics. Our dashboard bridges this gap by providing a centralized platform.
- Inefficient Resource Allocation: Without accurate data, allocating resources optimally becomes challenging. Our dashboard helps you allocate resources based on actual demand and performance.
- Risk Blind Spots: Supply chains face various risks—supplier disruptions, demand fluctuations, and geopolitical events. Our dashboard highlights potential risks early, allowing proactive mitigation.
- Data Overload: Raw data overload can hinder decision-making. Our dashboard simplifies complex information, making it actionable and relevant.
- Missed Growth Opportunities: By analyzing KPIs, you can uncover growth avenues. Our dashboard ensures you don’t miss out on strategic opportunities.