INSIGHTS = OPPORTUNITIES
Thing's that make KPI Reports so good
Engaging Reports for
better insights
Using KPIs and Metrics to track business objectives clearly has its advantages. But with so much data being produced, storing, visualizing and then communicating results can become a drain on resources.
At the very core of SimpleKPI is the ability to produce a complete range of multi-dimensional KPI reports. Quickly see how your most important metrics are performing against their targets; use comparisons to plot the difference between previous periods, and distribute real-time data to key decision makers.

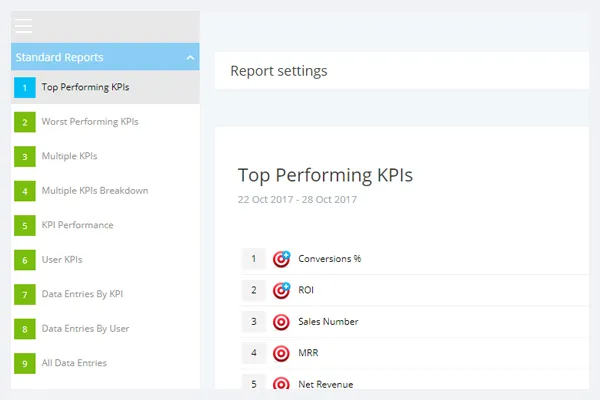
Standardized your KPI Reporting
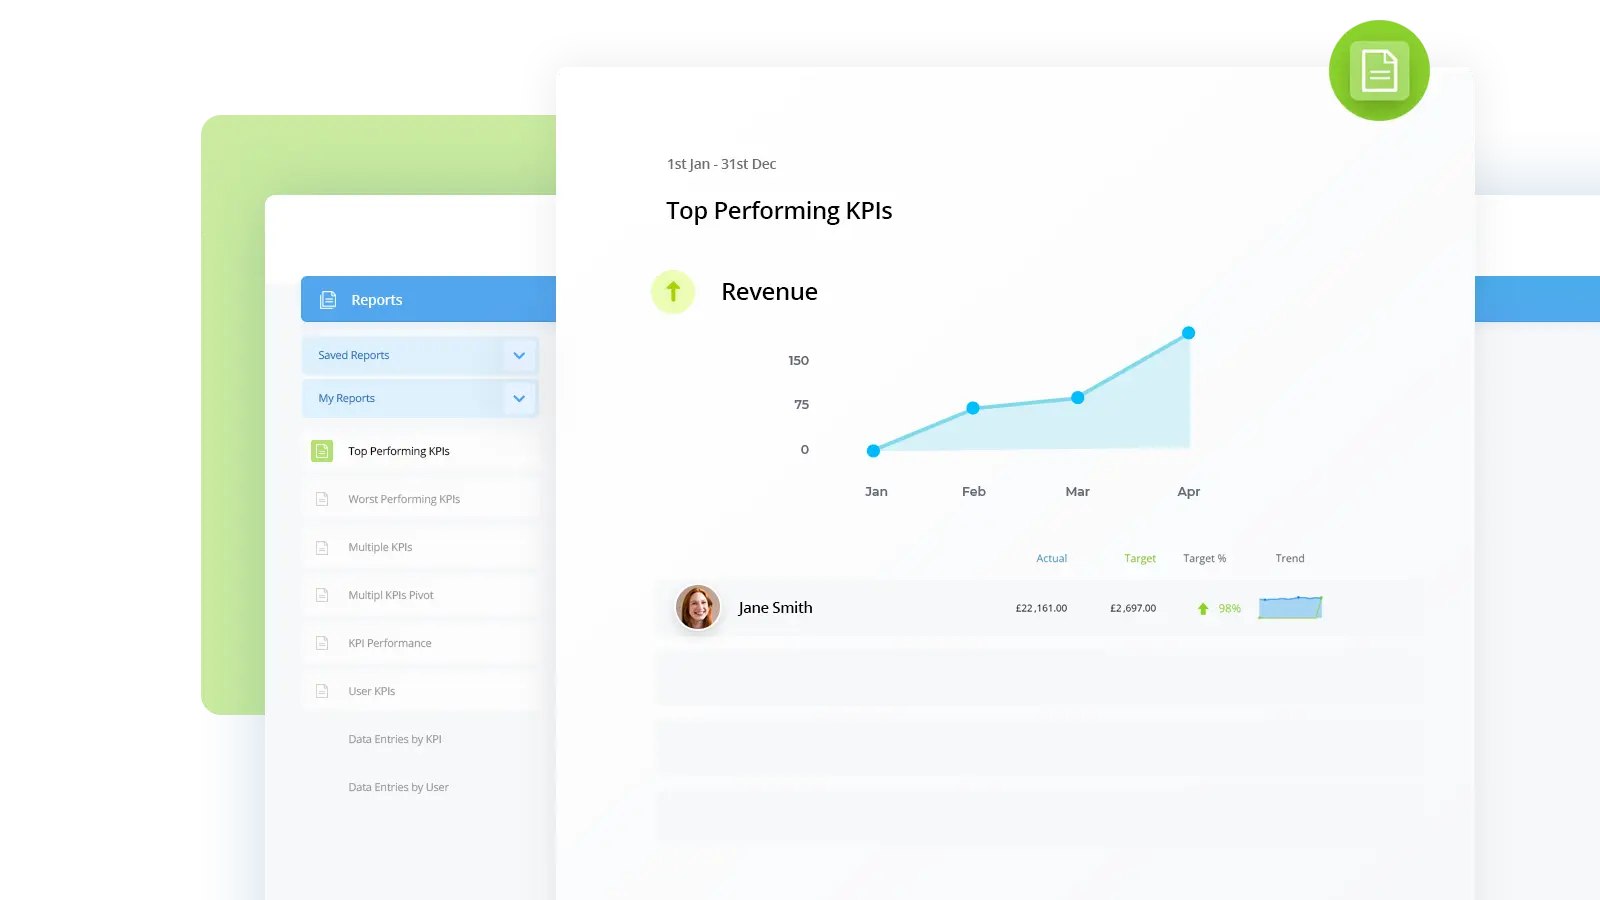
Building reports from scratch can take time and energy. That's why we've developed a series of standard reports to give you a helping hand. You can use them to quickly see Top performing KPIs, a comparison between a series of metrics or even a user's data entries.
Create a standard KPI ReportChoose from a series of performance criteria such as:
- Top Performing: A snapshot of your best performing KPIs or metrics.
- Worst performing: Quickly highlight those KPIs or metrics that are failing their targets.
- Multiple KPIs: Group KPIs or metrics into a single data view for comparison or evaluating context.
- Multiple KPIs Breakdown: Use a multi-dimension breakdown to view the data behind the results.
- User KPIs: Easily see the actuals of all the KPIs that are assigned to a user.
- Data Entries by User: See an historic view of all the entries for a KPI over time.
- All Data Entries: View the actual data entries made by a user.
- KPI Performance:Look at all the data for every user and KPI.
- KPI Performance:Focus on an individual KPI, see the entries and user data for a specific KPI.
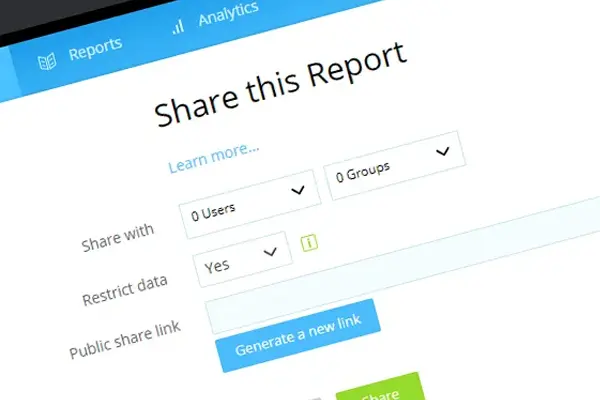
KPI Report Sharing
Collaborate with colleagues with a variety of sharing options
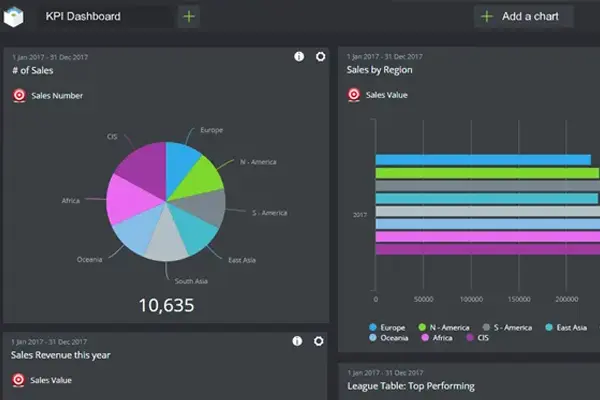
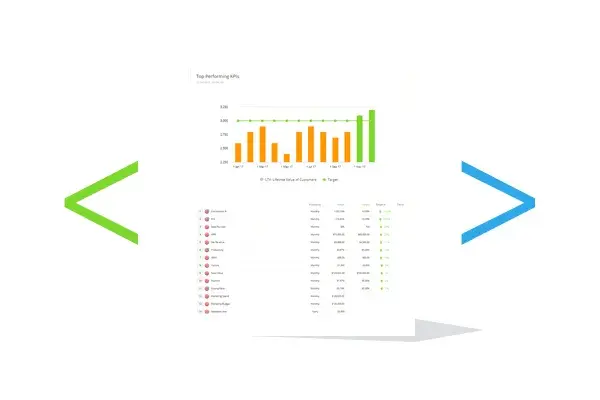
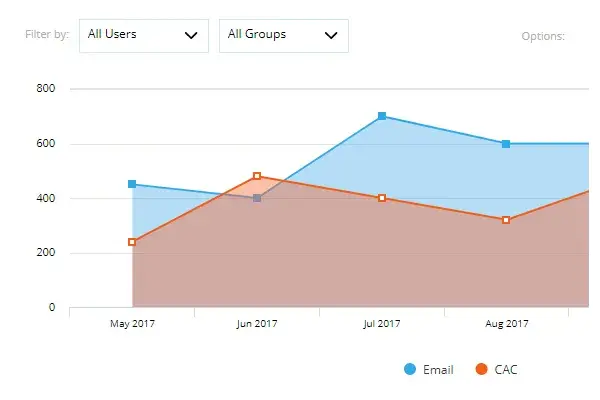
Visually appealing
Bring your data to life with professionally designed graphs and charts.
Embedding
Embed your dashboards and reports in your own web page or intranet.
Inbuilt Reports
Pre-designed reports can be used as a starting point to get started quicker
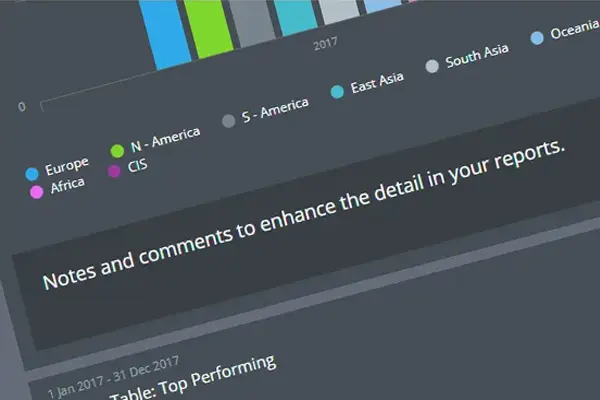
Notes and Comments
Add additional information, conclusions and context with notes and comments.
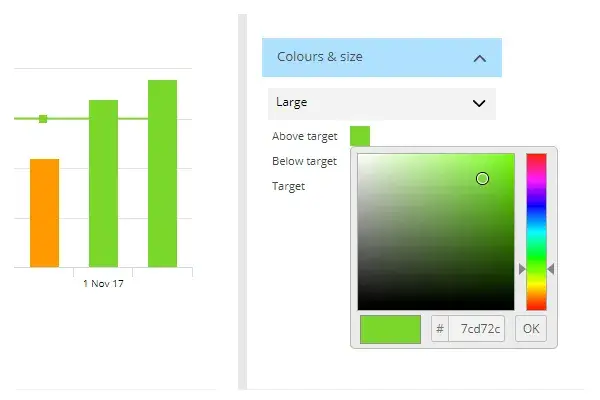
Customize
Choose from an array of colors and options for your dashboards and reports.
Analysis
Delve deeper into your data to identify the reasons for those dips and rises.

Exporting
A range of export options, for distributing reports more widely
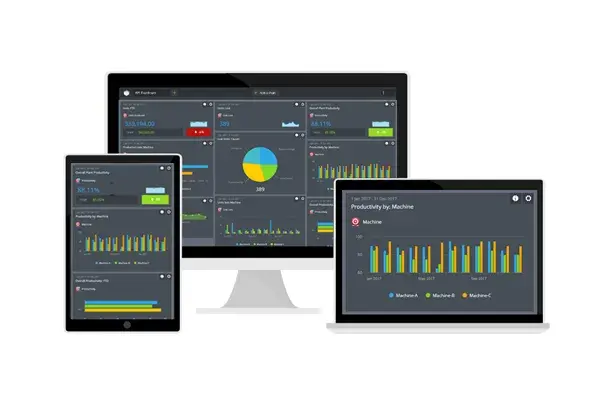
Fully Responsive
Real time reports can be viewed on mobile devices while on the go
How to build a KPI Report
Developing and then distributing your KPIs can be a daunting task, with so much data, a near endless variation of graphs and charts and the pressure to get it right first time, it's no surprise that it can become more than a little confusing. So here's a little help in designing your reports.
Create your first report
5 simple steps for creating robust KPI Reports:
- Initially, choose a small number of KPIs or metrics.Focus on those measures that can provide instant and meaningful insights. Quick wins will help with the adoption of your reports in the early stages.
- Organize measures together in a logical manner. If it's a strategic report keep it focused on strategy. Building a story from the data with an intuitive flow will also make a more understandable and engaging report.
- Focus on charts and graphs to present your data.Not only do visuals allow an audience to quickly understand complex data sets, including trends will allow your audience to make conclusions in historical context. That said its always useful to have the background data available for reference out of sight.
- Provide a conclusion.Keep it simple and bullet point the most important interpretations of the data.
- Share and adjust.You'll never get it perfect first time. Set out a timetable for revising the content and provide a feedback mechanism for gathering ideas.
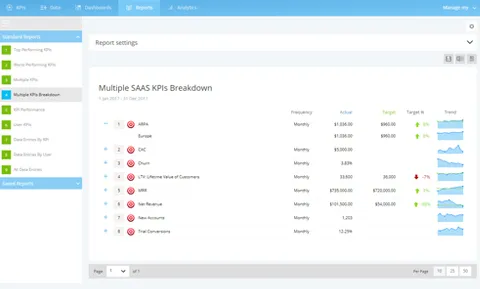
Multiple KPI Report
Multiple KPI Report for SAAS companies showing a breakdown of the underlying data
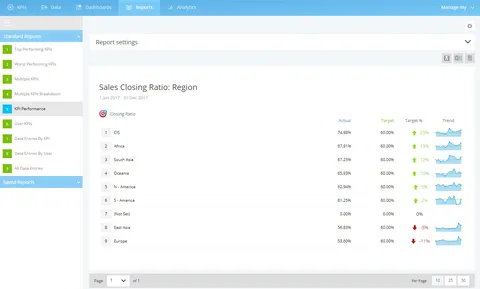
KPI Performance Report
Detailed sales closing ratios can be displayed using the KPI Performance report.
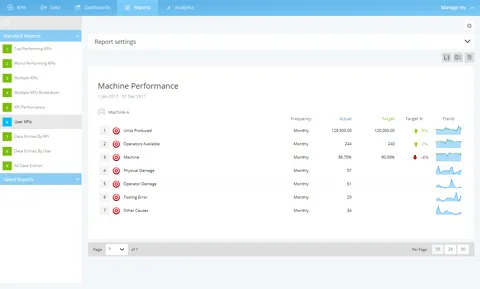
Users KPI Performance
User based reports can be customized to display the performance of Users, Machinery or equipment.
The benefits of KPI Reporting
An automated reporting platform will take the hassle out of data collation and simplify communication. But the advantages don't stop there. When KPIs and Metrics are brought together they provide a pivotal point of reference for management decisions and analysis. They can assist in increasing productivity, providing accurate information and many more benefits, such as:
5 simple steps for creating robust KPI Reports:
- Initially, choose a small number of KPIs or metrics: Focus on those measures that can provide instant and meaningful insights. Quick wins will help with the adoption of your reports in the early stages.
- Organize measures together in a logical manner: If it's a strategic report keep it focused on strategy. Building a story from the data with an intuitive flow will also make a more understandable and engaging report.
- Focus on charts and graphs to present your data: Not only do visuals allow an audience to quickly understand complex data sets, including trends will allow your audience to make conclusions in historical context. That said its always useful to have the background data available for reference out of sight.
- Provide a conclusion: Keep it simple and bullet point the most important interpretations of the data.
- Share and adjust: You'll never get it perfect first time. Set out a timetable for revising the content and provide a feedback mechanism for gathering ideas.
Best Practice
Planning is fundamental for implementing a KPI strategy. Putting together a good plan of objectives, targets and goals when developing your reports will smooth the process, and provide the maximum return from your efforts.
7 tips for good reporting practice:
- Decide early in the planning stage when your reports will be used:if its monthly meetings then assure that all data is up to date to avoid misleading analysis.
- Focus on an individual area or highlight a single message:nothing will turn your hard efforts into nothing more than an illegible mess than an overload of data and charts. Reducing the colors also will create a more professional and visually appealing report.
- Don't get disorientated: Metrics and KPIs can be found just about everywhere you look. Consider the importance of each KPI to your organization. Is it relevant to include this in a report?
- Start with a single report: and build slowly. It's far easier to get buy in from colleges if they see understand the benefit and then contribute to future additions.
- Fresh data will install trust in your reports: Ensure the data is accurate and up to date – it's worth spending time exploring how, when and where the data is collected.
- Add context by using historical trend graphs:Also consider including a background summary, this will help reduce wild or over analysis and misinterpretation of the data.
- Keep your reports on the rails: It's very easy for companies to get sucked back into the day job and neglect the data. Adding accountability to colleagues, time-frames for submissions and actions will help integrate the reports into a natural business process.
Whether it's the analysis of statistical data, regular reporting collation or you just need to track metrics more efficiently. SimpleKPI provides a reliable and engaging KPI reporting platform where data insight can be gained, and tangible improvements made.
A KPI report is a tool that helps businesses track performance and make informed decisions. It allows you to efficiently analyze key performance indicators and understand how your performance stacks up against to specific goals. KPI reports include data visualization, consisting of charts, tables, and graphs, which help you easily identify trends and patterns in your data.
Yes, you can export your KPI Reports to either Excel, CSV or PDF formats.
yes, all KPI Reports can be used as they are, or can be used as starting points to create, save and share you own customized reports.
You can create and share as many reports as you need. There is no restriction on the number that can be used in the system