First Published:
It's almost universally accepted that most sales department KPIs are concentrated on revenue. Either collectively as in the performance of sales teams - defined by revenue generation, or they may be segmented by an individual or even by product type.
A business measures the success of sales as delivering and exceeding the targets set out in the business revenue goals. Most companies do not rely solely on headline sales revenue for measuring success. They focus on a mixture of sales-based motivation techniques and expectations of income based on process-centric KPIs, such as that more calls made should lead to more sales – if a consistent conversion rate is achieved.
In the following article, we will explore:
- Transforming sales objectives into KPIs
- 22 Sales KPIs with examples
- Communicating your Sales KPIs on Dashboards and Reports
- Sales KPIs vs traditional sales tracking
- Conclusion
Transforming sales objectives into KPIs
When it comes to selecting the right Sales KPIs for your business, there are several factors to consider. First and foremost, you must decide what sales goals you want to track. Do you want to measure overall revenue growth? Or do you need more targeted metrics, such as customer retention or lead conversion rates? Considered how often data needs to be collected and reported. Once you have established the main objectives of your sales KPI tracking, you can determine which specific metrics will help meet those objectives. If you are new to turning objectives into KPI, then this article is worth a read.
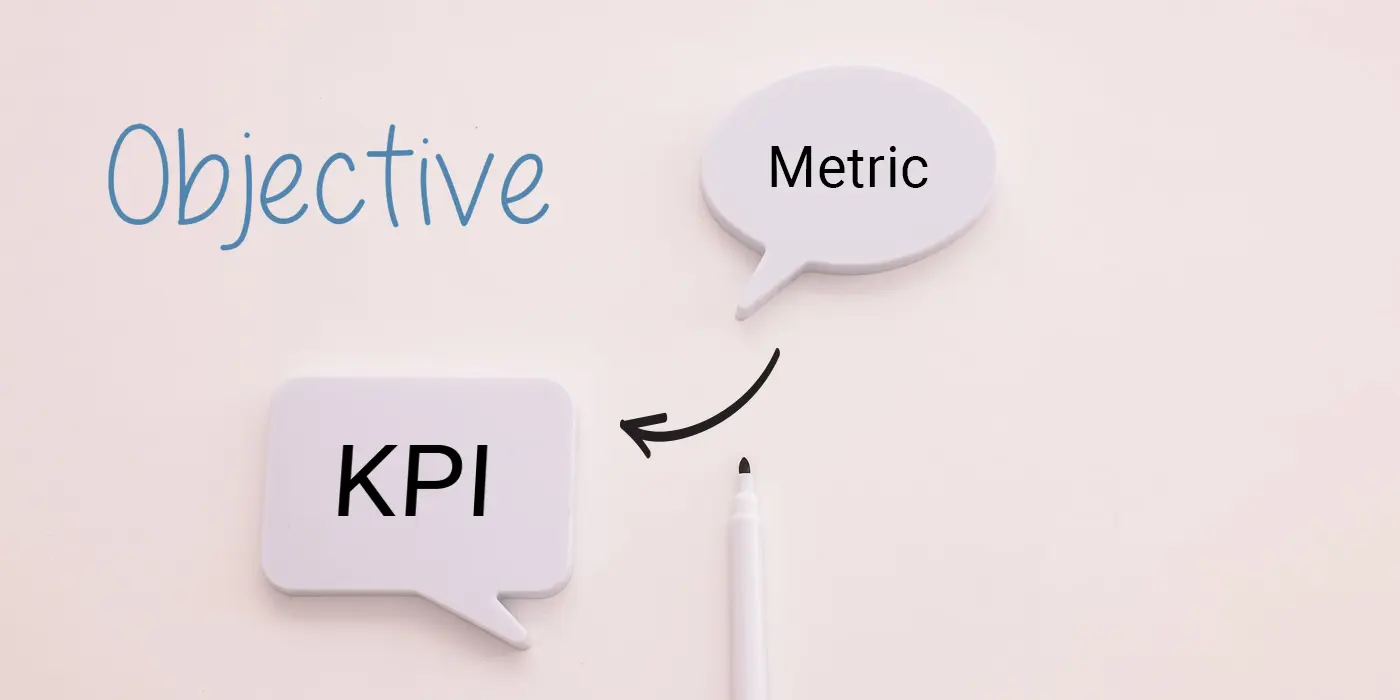
An example of an objective-driven KPI may look like this:
- Objective: Increase Sales Revenue by 20% for our hedge strimmers and accessories this season.
- Measurable Target: $500,000 (20% increase on the previous season).
- Frequency: Measured Monthly and to be completed by the end of August (strimming season).
- Metric A: Strimmer Sales Revenue.
- Metric B: Strimmer Accessories Revenue.
- KPI: (Strimmer Sales + Strimmer Accessories Revenue).
In the above example, you would also typically track the volume of sales and use these KPIs to track additional information, such as the ratio of sales and average sales cost on a dashboard.
It's also important to choose KPIs that are appropriate for your team's abilities and resources. If you can't accurately track specific metrics investing in new technologies or dedicated KPI software is a must. Additionally, select KPIs that can be easily understood by all stakeholders so that everyone can work together towards reaching common goals.
Finally, you should set realistic and achievable targets for each KPI. Although it's tempting to aim high when setting sales goals, doing so without considering your team's capacity can create unrealistic expectations and lead to frustration and poor performance.

22 Sales KPIs with examples
Expanding a performance-tracking initiative to include this type of KPI can be a little daunting, so here is a complementary blend of process and revenue KPIs for a sales department.
-
Sales growth rate
Measures: the percentage increase in sales over a specific period of time. It’s calculated by dividing the difference between current sales and previous sales by previous sales and multiplying by 100.
Input frequency: Monthly.
Example: If your sales were $100,000 last month and $120,000 this month, your sales growth rate would be 20%.
-
Sales revenue
Measures: The total amount of revenue generated by the sales department over a specific period.
Input frequency: Monthly.
Example: If your sales department generated $500,000 in revenue last month, your sales revenue for that month would be $500,000.
-
Customer acquisition cost
Measures: the cost of acquiring new customers. It is calculated by dividing the total cost of sales and marketing by the number of new customers acquired.
Input frequency: Monthly.
Example: If your sales and marketing costs were $50,000 last month and you acquired 100 new customers, your customer acquisition cost would be $500.
-
Customer lifetime value
Measures: The total revenue generated by a customer over their lifetime.
Input frequency: Quarterly.
Example: Let’s say a customer spends an average of $1,000 per year with your company and stays with you for 5 years, their customer lifetime value would be $5,000.
-
Sales conversion rate
Measures: The percentage of leads that convert into paying customers.
Input frequency: Daily.
Example: If you had 100 leads yesterday and 10 of them became paying customers today, your sales conversion rate would be 10%.
-
Average deal size
Measures: The average value of each sale made by the sales department.
Input frequency: Monthly.
Example: If your sales department made 50 sales last month with a total value of $100,000, your average deal size would be $2,000.
-
Sales pipeline velocity
Measures: How quickly leads move through the sales pipeline.
Input frequency: Weekly.
Example: If it takes an average of 30 days for a lead to become a paying customer and you have 100 leads in your pipeline, your sales pipeline velocity would be 3.
-
Sales cycle length
Measures: How long it takes for a lead to become a paying customer.
Input frequency: Weekly.
Example: If it takes an average of 30 days for a lead to become a paying customer, your sales cycle length would be 30 days.
-
Sales win rate
Measures: The percentage of deals that are won by the sales department. It is calculated by dividing the total number of deals won by the overall number and multiplying by 100.
Input frequency: Daily.
Example: If you had 10 deals yesterday and you won 3 of them today, your sales win rate would be 30%.
-
Sales velocity
Measures: How quickly deals move through the sales pipeline.
Input frequency: Weekly.
Example: If it takes an average of 30 days for a deal to move through the pipeline and you have 10 deals in progress, your sales velocity would be 0.33.
-
Sales per rep
Measures: The total revenue generated by each sales representative.
Input frequency: Monthly.
Example: If you have 5 sales reps and they generated a total of $500,000 in revenue last month, their average sales per rep would be $100,000.
-
Sales per lead
Measures: The total amount of revenue that’s generated by each lead.
Input frequency: Monthly.
Example: If you had 100 leads last month and they generated a total of $50,000 in revenue, your average sales per lead would be $500.
-
Lead response time
Measures: How quickly sales reps respond to leads.
Input frequency: Daily.
Example: If it takes an average of 2 hours for a sales rep to respond to a lead and you received 10 leads yesterday, your lead response time would be 2 hours.
-
Lead conversion rate
Measures: The percentage of leads that are convert into paying customers.
Input frequency: Daily.
Example: If you had 100 leads yesterday and 10 of them became paying customers today, your lead conversion rate would be 10%.
-
Customer retention rate
Measures: The percentage of customers that continue to do business with your company over a specific period of time.
Input frequency: Quarterly.
Example: If you had 1,000 customers at the beginning of the quarter and only lost
-
Sales growth rate by product
Measures: The percentage increase in sales for each product over a specific period. It is calculated by dividing the difference between current sales and previous sales for each product by previous sales for each product and multiplying by 100.
Input frequency: Monthly.
Example: If your sales for Product A were $10,000 last month and $12,000 this month, your sales growth rate for Product A would be 20%.
-
Sales revenue by product
Measures: The total amount of revenue generated by each product over a specific period of time.
Input frequency: Monthly.
Example: If your company sells three products (Product A, Product B, and Product C) and you generated $10,000 in revenue from Product A, $5,000 from Product B, and $7,000 from Product C last month, your sales revenue by product would be $10,000 for Product A, $5,000 for Product B, and $7,000 for Product C.
-
Sales revenue by region
Measures: The total revenue generated by each region over a specific period of time.
Input frequency: Monthly.
Example: If your company operates in three regions (Region A, Region B, and Region C) and you generated $50,000 in revenue from Region A, $30,000 from Region B, and $20,000 from Region C last month, your sales revenue by region would be $50,000 for Region A, $30,000 for Region B, and $20,000 for Region C.
-
Sales revenue by customer type
Measures: The total revenue generated by each customer type over a specific period of time.
Input frequency: Monthly.
Example: If your company has two types of customers (Type A and Type B) and you generated $40,000 in revenue from Type A customers and $60,000 from Type B customers last month, your sales revenue by customer type would be $40,000 for Type A customers and $60,000 for Type B customers.
-
Sales revenue by sales rep
Measures: The total revenue generated by each sales representative over a specific period of time.
Input frequency: Monthly.
Example: If you have three sales representatives (Rep A, Rep B, and Rep C) and Rep A generated $20,000 in revenue last month while Rep B generated $15,000 in revenue and Rep C generated $25,000 in revenue last month, your sales revenue by sales rep would be $20,000 for Rep A, $15,000 for Rep B, and $25,000 for Rep C.
-
Sales revenue per square foot
Measures: The total amount of revenue generated per square foot of retail space.
Input frequency: Monthly.
Example: If your company has a retail store that is 1,500 square feet in size and you generated $100,000 in revenue last month from that store location only then your sales revenue per square foot would be approximately $66.
-
Sales revenue per employee
Measures: The total amount of revenue generated per employee.
Input frequency: Monthly.
Example: If your company has ten employees and you generated $5000 in revenue last month, then your sales revenue per employee would be approximately $500.
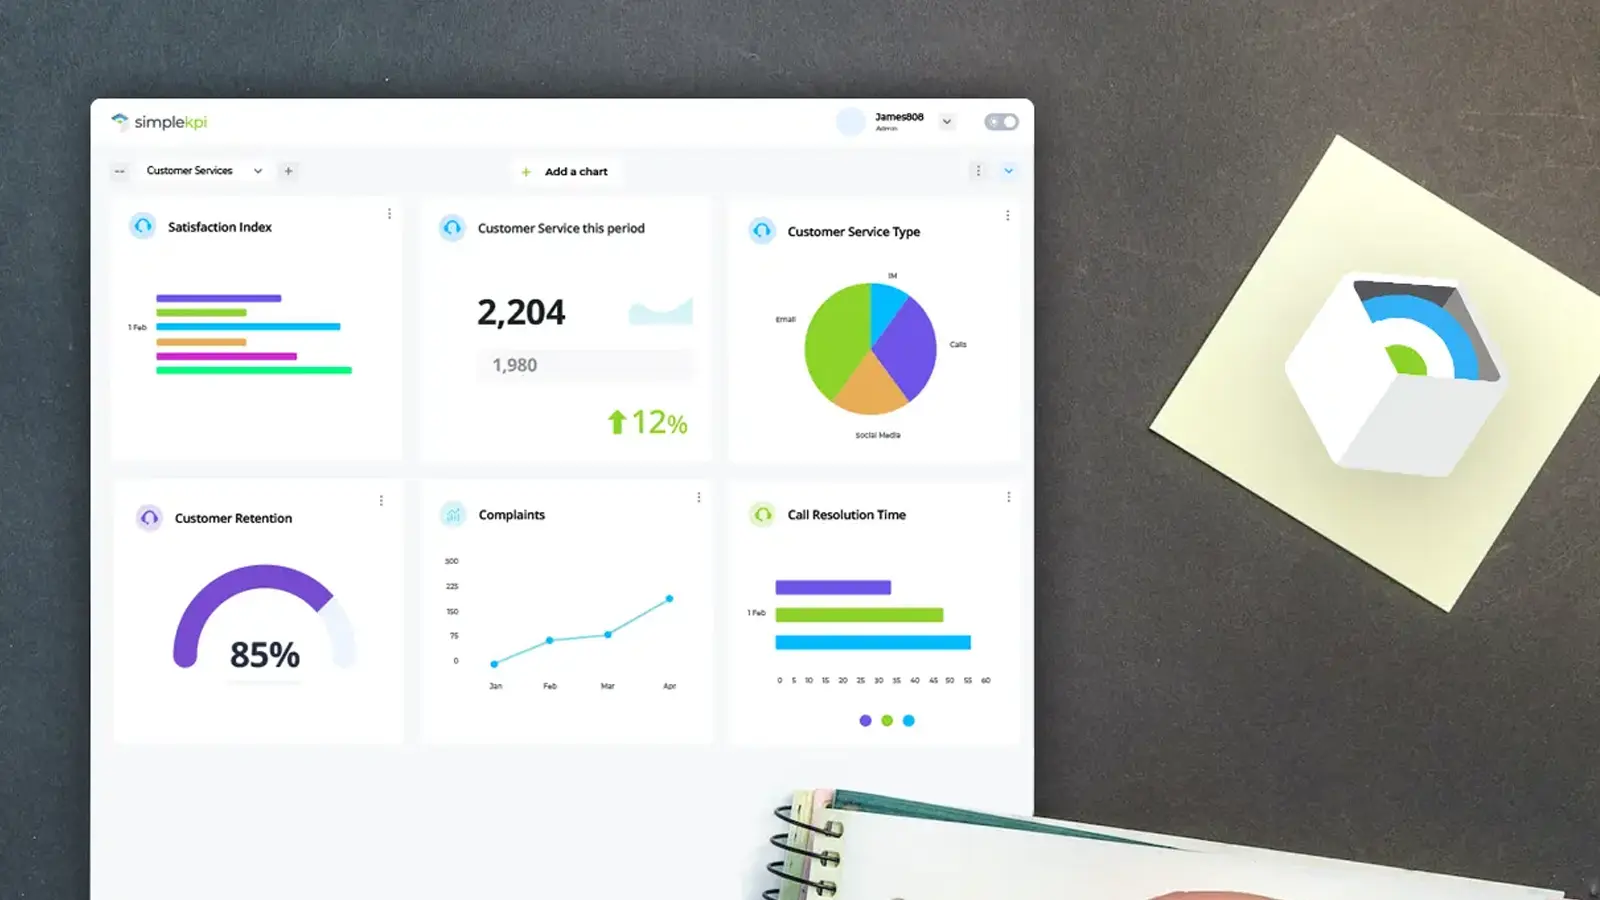
Communicating your Sales KPIs on Dashboards and Reports
The importance of presenting sales KPIs across teams and departments in a way that is easy to understand and visually appealing can make or break a sales drive. Here are some tips and tricks to help you visualize your KPIs on a dashboard or report.
By following these examples, you can create a sales KPI dashboard that is both informative and visually appealing. Remember to focus on the most relevant KPIs, use visualizations wisely, keep it simple, use color strategically, and provide context to help your sales team make informed decisions.
-
Choose the right KPIs
It may sound obvious, but not all KPIs are created equal. It's as important to choose the most relevant KPIs for your sales team as it is to set realistic goals that can be measured; an excellent process to follow would be the KPI selection process by the KPI Institute.
-
Use Dashboard Visualizations
Visualizations are a great way to make complex data more understandable. Use graphs, charts, widgets and other visual elements to help your sales team quickly identify trends and patterns in the data. The addition of a league table can also introduce a little competition into the process.
-
Keep it simple
Don't overload your dashboard with too much information. Keep it simple and focus on the most important KPIs. This will make it easier for your sales team to understand and act on the data.
-
Use color wisely
Color can be a powerful tool in data visualization, but it can also be distracting if used improperly. Use color sparingly and strategically to highlight important data points and trends.
-
Provide context
It's important to provide context for your sales KPIs. This could include comparing current performance to past performance, industry benchmarks, or sales targets.
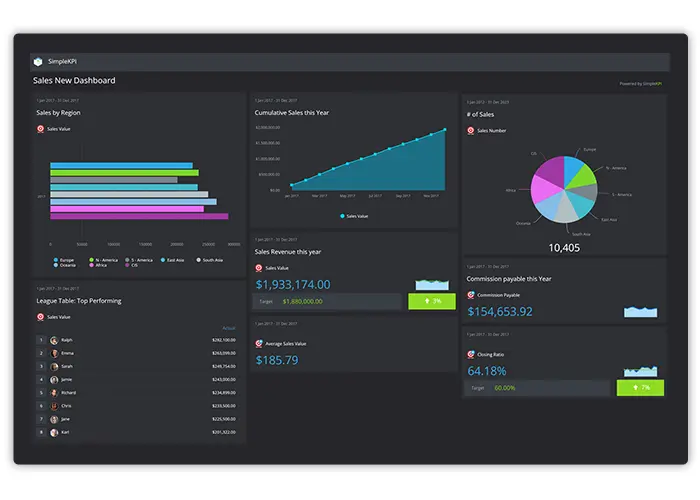
For inspiration, please check out our Sales KPI Dashboard Example.
Sales KPIs vs traditional sales tracking
In today's business landscape, tracking sales performance is essential for the success of any organization. However, relying on traditional sales tracking methods alone might not be enough to achieve optimal results. That's why many companies are now turning towards Key Performance Indicators (KPIs) as a more effective way to monitor their sales performance.
KPIs are a set of quantifiable metrics that help businesses evaluate their progress toward achieving specific goals and objectives. By focusing on KPIs, companies can gain a deeper understanding of their sales pipeline, customer behavior, and overall revenue performance.
Compared to traditional sales tracking methods, KPIs offer several advantages. First, they provide a more accurate and real-time view of sales performance, allowing businesses to make data-driven decisions faster. Second, KPIs help identify areas of improvement and highlight potential bottlenecks in the sales process. Finally, KPIs enable businesses to align their sales efforts with their overall strategy, ensuring that every action taken is in line with the company's long-term goals.
Conclusion
Sales KPIs are an essential tool for tracking and monitoring the performance of your sales team. By selecting the most relevant metrics, developing a dashboard that is easy to understand and visually appealing, providing context to help your sales team make informed decisions, and understanding the advantages of using Sales KPIs over traditional methods, you can ensure that your business is driving towards success.

by Stuart Kinsey
Stuart Kinsey writes on Key Performance Indicators, Dashboards, Marketing, and Business Strategy. He is a co-founder of SimpleKPI and has worked in creative and analytical services for over 25 years. He believes embracing KPIs and visualizing performance is essential for any organization to strive and grow.